Triple Index Trend Channel Surfing Update August 3
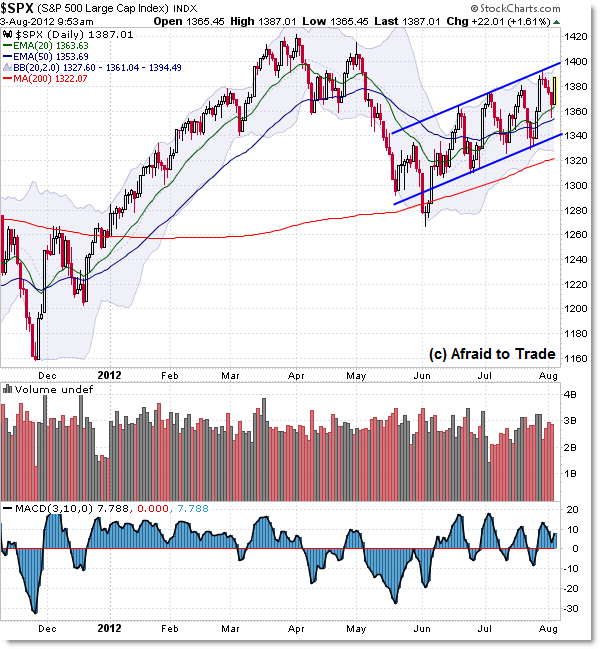
From a chart perspective, the big news is that the main US Equity Indexes continue to trade within the clear trendline boundaries of a parallel trendline channel.
Let’s take a quick look at the new boundaries and structural levels to watch after another successful week in the pattern.
First, the S&P 500 Daily Chart:

As mentioned in the July 24 update, the S&P 500 STILL continues to trade within the established boundaries from the rising parallel trendline pattern.
Above any other technical (charting) factor, these visual parallel trendlines have been the most effective factor for successful short-term and intraday trading.
With that in mind, we’ll continue monitoring these boundaries so long as price remains within the trendlines.
At the moment, price appears to be trading upward to the new upper level at the 1,400 region.
Let’s zoom-in the perspective to the intraday charts of the “Big 3” US Equity Indexes:

When constructing trendlines, the goal is to draw a line that touches as many points as possible.
Traders may draw slightly different trendlines using the same price data, so it’s important to see trendlines as ‘zones,’ rather than absolute walls or floors.
It’s also important to zoom-in the perspective when price (on the Daily Chart) trades at a key trendline level – look for any divergences or additional information you can find on the intraday frame (especially with momentum and market internal divergences).
It’s an ideal – though never guaranteed – trading opportunity when price challenges a higher timeframe “obvious” trendline level and displays divergences or reversal signal on the lower frames.
As we’ll see in all three indexes, Thursday’s sell-off did not trade all the way back to the lower level, and Friday morning’s gap thrust price all the way back to the upper level quickly.
The upper S&P 500 boundary trades just above 1,390 with respect to the “Round Number Resistance” at 1,400. The lower level trades near 1,340.
The structure in the Dow Jones Index is similar to the S&P 500:

The commentary and analysis are the same, so we’ll focus on the key levels to watch:
The upper trendline trades above 13,100 (with respect to the most recent swing high from July) while the lower trendline rests at 12,600.
This week’s downside action ceased at the 12,800 level ahead of this morning’s opening gap back into resistance.

Finally, the NASDAQ Index shows a slightly different pattern – unlike the S&P 500 and Dow Jones, the NASDAQ peaked in early July and has formed a declining short-term upper trendline through July.
This morning’s upside action threatens a break of the 2,960 trendline and prior resistance level, and the upper boundary extends towards 3,000’s “Round Number Resistance.”
The lower rising support line trades under 2,880.
Patterns are helpful for revealing structure and key levels on which to base our trading game-plans, especially on the intraday or short-term strategies.
Until we see a breakout from these clear trendline patterns, continue monitoring real-time developments within the context of the ongoing “Rising Parallel Trendline Channel” boundaries.
Corey Rosenbloom, CMT
Afraid to Trade.com
Follow Corey on Twitter: http://twitter.com/afraidtotrade
Corey’s new book The Complete Trading Course (Wiley Finance) is now available!

Excellent analysis once again Corey!
Learn how you can know the current stock market
condition. Stock market traders should know the ongoing share market
scenario so as to succeed in it.