Updating Distribution Volume Trends in SPY and DIA
Here’s an update to a prior volume-centric post that highlighted the April trend towards Distribution Volume in the US Equity Markets.
The recent sharp sell-off confirmed the earlier signals and added to the broader Distribution Picture.
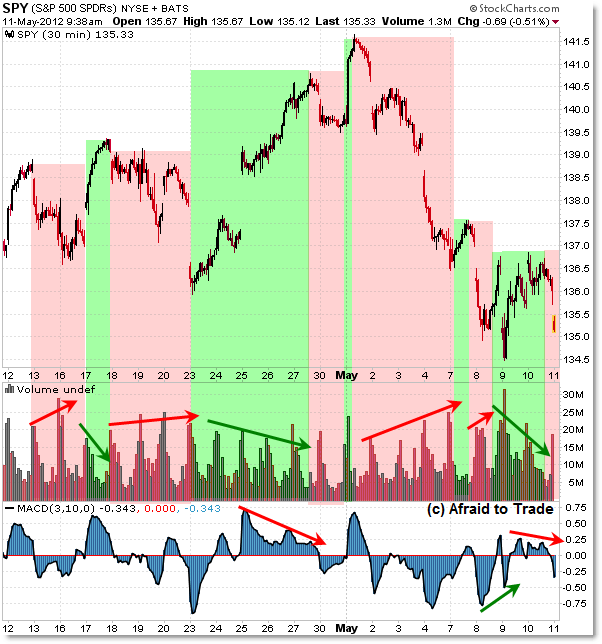
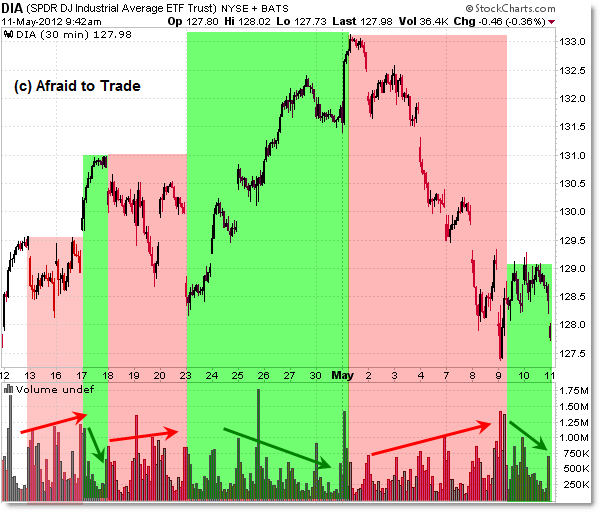
Let’s take a look at the current “Volume Only” color-coded SPY and DIA (S&P 500 and Dow Jones ETF) charts:

Dow Jones ETF: DIA

Start with the April 11th original “April Distribution Volume Trends” for background information and to see what the Distribution Volume picture was in early April.
To recap, according to classical Technical Analysis, volume should confirm price (part of Dow Theory).
What this means is that if Volume and Price move in the SAME direction, expect the price movement to continue.
Instead, if Volume and Price move in opposite directions, expect a future reversal.
Beyond this, we can compare how volume performs on upswings (rallies) or down-swings (declines) in price to get a sense of the bigger picture of money flow.
This can help us see if money is aggressively flowing IN to a rising market (which is bullish) or flowing out of a falling market (which is bearish).
Now, back to the current picture.
I color-coded the recent intraday swings as either “rallies” or “declines” accordingly so that we could clearly see the trend or progression of volume – rising or falling.
It should be clear that during green rallies, volume has been declining or falling (again as price is rising) and that during sell-offs or declines, volume has been progressively rising.
This points to a broader pattern of Distribution – less enthusiasm/activity during rallies and more activity/transactions during declines.
Put in the larger context of an over-extended rally and the seasonal “Sell in May and Go Away” sentiment, this at least paints a picture of caution for the equity markets.
We’ll always let price be the main guiding factor, but for the moment, volume trends/signals paint a cautious to outright bearish picture that we need to monitor closely in the weeks ahead.
Corey Rosenbloom, CMT
Afraid to Trade.com
Follow Corey on Twitter: http://twitter.com/afraidtotrade
Corey’s new book The Complete Trading Course (Wiley Finance) is now available!

Trendline and Fibonacci Confluence in India Nifty Index
Hi Corey – Can yo update more on this