Volume Surge in UNG Natural Gas Fund
Might a recent volume surge in UNG (Natural Gas ETF) hint that higher prices are yet to come? Let’s take a look at UNG’s long-term weekly structure and then step inside the ‘volume surge’ on the Daily Chart.
UNG (Natural Gas ETF) Weekly:

What’s most interesting is the sudden spike last week to over 200 million shares transacting in a single week – a record for this exchange traded fund.
It would certainly appear some fund (or group of funds) is ‘up to something’ perhaps through this ‘unnatural’ movement.
Price has been coming off a steep downtrend since the mid-2008 commodity peak which sent all commodities plunging to new lows into 2009.
Crude Oil has already completed its “Rounded Reversal” pattern with more room perhaps still to run but Natural Gas hasn’t been so lucky to rise as crude oil did.
Now might be the beginning of a potential multi-month rise… or at least we’re granted a potential low-risk opportunity if your analysis reveals as much.
Let’s step inside the volume surge on the daily chart.
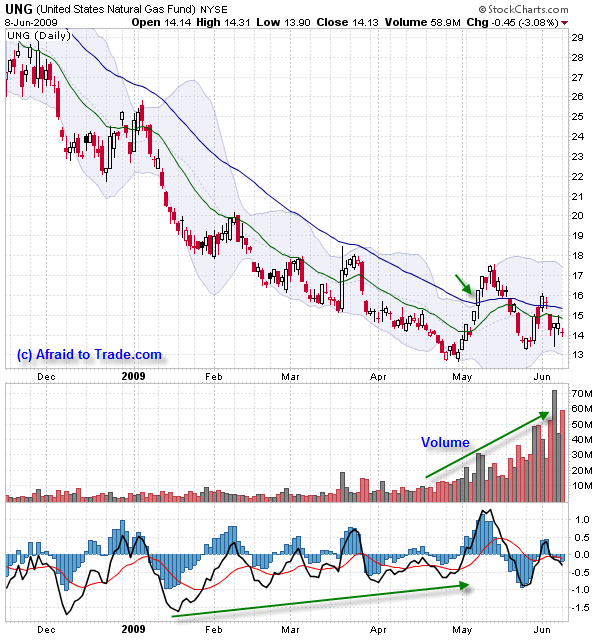
.UNG (US Natural Gas ETF) Daily:

Price formed a new low beneath $13 per share in late April, and price appears to be forming some sort of triangle consolidation off these lows.
Price level $13 seems to be holding strong support (offering an ideal location for a stop just beneath it) while we could be seeing a pure “Rounded Reversal” (trend reversal) taking place at these levels.
It’s quite unique to see volume surge with such consistency as we’re seeing in UNG above.
The 3/10 Momentum Oscillator registered a new high, which could hint that a price high is yet to come.
Price also broke recently above the 20 and 50 EMAs (only to fall back beneath them) which is a prerequisite for price to form a reversal into an uptrend.
Let’s keep watching Natural Gas and specifically UNG for any signs of strength or follow-through to the upside.
Corey Rosenbloom, CMT
Afraid to Trade.com
Subscribe for the RSS Feed here.
Follow Corey on Twitter: http://twitter.com/afraidtotrade

It called an ugly bottom pattern, if , we stay over the lows.
It is quite interesting. But may not be a long play if it breaks.
definitely a interesting signal considering the volume has been consistently rising and fast. Helene Meisler noted this morning that UNG has a cycle of ~2 yrs, so we're nearing another low/trough…but might be next hurricane season (2010 sept/oct) ish before we see the next peak. Either way, picked up a little down here for family's long term long-only accounts, aware that we could make a lower low for a inverse “head” of H/S before base is complete and we go higher like crude did. this chart looks like crude several months ago before the launch…
ung…looks like triangle almost complete…and now testing lower trend line at 14.00….is this a continuation pattern suggesting a break to the down side… seems like everyone is getting bullish here and no one is talking about further price declines here…what do u think…
hmmm….nat gas up 64% off its low, UNG up 25% off its low…..doesn't seem like the fund is doing what its designed to do….other than make the fund managers and company rich at investors expense
I don’t understand what's append with UNG-Gas fund, today price 7,94. It’s to low or not?
I don’t understand what's append with UNG-Gas fund, today price 7,94. It’s to low or not?