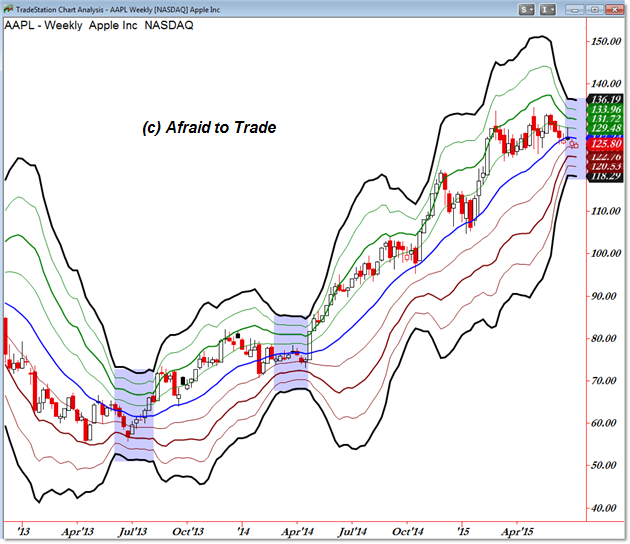
Weekly Bow Tie Ribbon forming on Apple AAPL Sigma Chart
An update to our Weekly (and Daily) Sigma Band Chart of Apple (AAPL) reveals another tight volatility compression or “Bow Tie” Pattern.
What does this mean and what can we expect once this pattern resolves?
Simple – let’s take a look:

For a bit of background, see my recent S&P 500 Sigma Band chart for definitions and explanations.
Main idea – the chart above is an expanded Bollinger Band Chart with standard deviation bands – also called “Sigma Bands” highlighting four standard deviations above and beneath the mean or 20 day (or week) moving average.
Sigma Charts help us quantify Volatility in a more professional manner than saying “price is moving a lot.”
Sigma Charts help us locate target levels to play for in a trade and also entry spots to trigger a trade (when price touches or moves away from a key level).
They can also be helpful in locating stop-losses for open positions.
These charts also help us visualize the Volatility Cycle, which states that price alternates between periods of low and high volatility.
Low volatility periods are highlighted by a “Bow Tie” or Squeeze Effect in the Bands as I’ve highlighted in blue.
Generally, a period of HIGH volatility emerges when a stock breaks free from a trading range from a LOW volatility environment.
Right now, we’re seeing a period of low volatility compression – which could extend – ahead of a likely breakout one way or the other for Apple (AAPL) shares.
Here’s the Daily Chart to plan short-term trading targets/set-ups:

Buyers have supported the stock – good buying spots – into the $124.50 level through most of 2015.
At the moment, this level is roughly the 2nd Standard Deviation (Sigma) beneath a falling (blue) average.
I highlighted a possible “Bullish Bounce” upward price pathway but also balanced that support level with a potential “Bearish Breakdown” pathway should Apple shares fall beneath support.
Note also two periods of sharp upside bounces followed by equally sharp declines – almost like an Inverted “V.”
Whatever other indicators or strategies you’re using, be sure to pinpoint these levels and the message from Volatility – which is low at the moment – for trading Apple shares.
Corey Rosenbloom, CMT
Afraid to Trade.com
Follow Corey on Twitter: http://twitter.com/afraidtotrade
Corey’s book The Complete Trading Course (Wiley Finance) is now available along with the newly released Profiting from the Life Cycle of a Stock Trend presentation (also from Wiley).

Honestly I don’t exactly know what this means, but I am clear that if we follow these charts well then nothing can stop us from making consistent profits. I am fairly lucky that I work with OctaFX broker where I am always been taken care of with perfect news and analysis service, it’s just too good and allows me to become successful and the most crucial point is that we don’t need to pay anything at all for this stuff!
To be honest I usually prefer going with trends since that’s
what makes the whole difference in success or failures, if we go against the trend
then we are definitely in trouble waters. I am working with world’s finest
brokerage company in OctaFX, it never really lets me down given their handsome
benefits including the 50% bonus on deposit, it is a really block buster offer
to have for new comers like me given it’s absolutely useable for all of us.