Rocket Arc Pattern Completing in FXI China While We Focus on Greece
You’re missing breaking news and a “Rocket Arc” Pattern collapsing price to support in China if you’re hyper-focused on news from Greece recently – which is understandable.
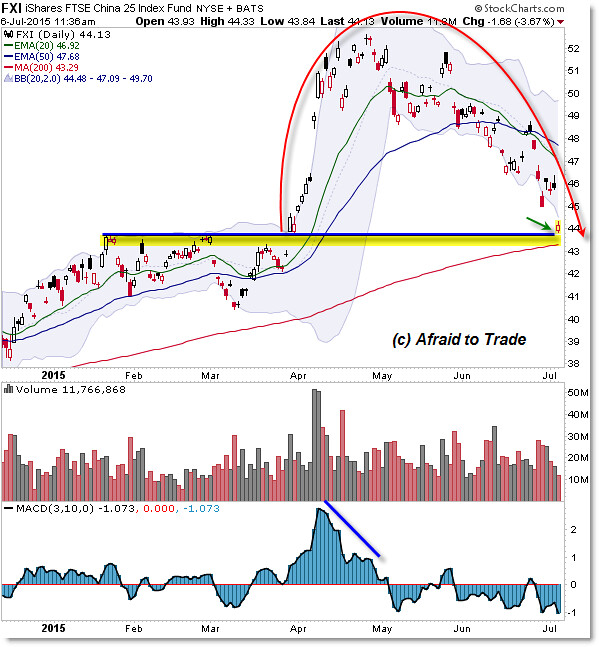
Let’s break through the clutter and highlight this price pattern which reflects a stellar price rise and the current collapse – or “return to earth” part of the Rocket Arc Pattern.
Here’s China’s FXI ETF (Daily Chart):

“Three Rocket Arc Price Patterns for Overseas ETFs EWG, EWS, and FXI”
In fact, today’s update post builds on the prior “Here’s a Rocket Arc forming in FXI” post.
Today’s post can be retitled “The Rocket Arc I mentioned Earlier Just Completed in FXI!”
Anyway, take a moment to read the prior post and how the other related country ETFs have performed.
For FXI China, we’re seeing headline risk and instability which has resulted initially in a “Rocket Arc” pattern in April that led to the current “Return to Earth” or liquidation/collapse phase we’re seeing right now.
While FXI highlights an ideal example of the Rocket Arc pattern, traders perhaps are most interested in what to do right now.
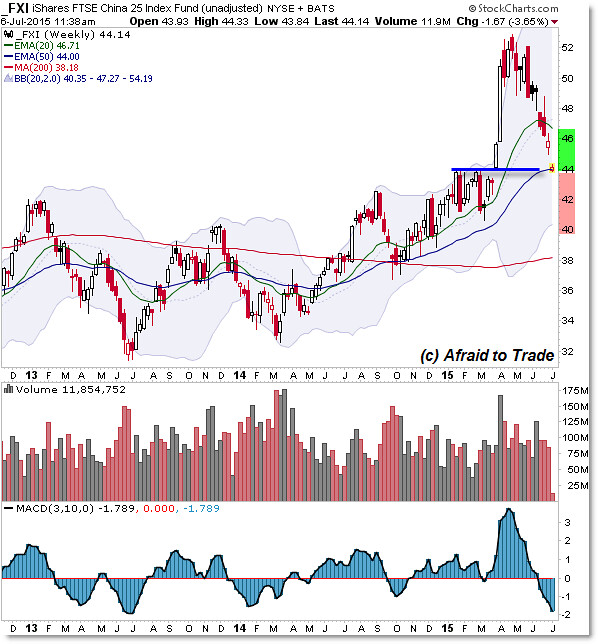
Let’s zoom-up to the Weekly Chart to highlight why the current pivot level – $44.00 per share – is critical.
FXI China 25 Weekly Chart:

The Rocket Arc pattern began with lift-off from the $44.00 resistance level earlier in 2015 and we pick up today’s analysis with the return-to-earth portion – back to the launchpad – at $44.00 per share.
With all the headlines (this post focuses on charts, not news/headlines specifically), be sure to focus on the $44.00 simple price pivot reference level for planning or managing any trades.
We look to key support/pivot levels to enter “support bounce” trades, making FXI an aggressive buy-entry candidate (tight stop) here or else as a “breakdown/reversal” candidate in the event sellers continue to pressure the price lower.
A breakdown under $44.00 triggers an agressive reversal short-sale entry which could lead to a play down toward the $41.00 level or lower.
As traders, our goal isn’t to predict but to join into the price movement generated by the winning side – be it bull or bear.
Price will move “away from” $44.00 per share’s key pivot and we can trade the price movement from this level.
Either way, whether you’re studying the “Rocket Arc” Pattern, or looking to trade/manage a position in China’s popular ETF FXI, focus your attention on the $44.00 per share pivot level right here.
Corey Rosenbloom, CMT
Afraid to Trade.com
Follow Corey on Twitter: http://twitter.com/afraidtotrade
Corey’s book The Complete Trading Course (Wiley Finance) is now available along with the newly released Profiting from the Life Cycle of a Stock Trend presentation (also from Wiley).

This looks very cool pattern, but as you said the whole world is really focusing on Greece, it is the talk of the moment. I have many of my trades on only due to that and that’s why I have got fairly decent results. I am lucky that I have got a swap free account with high class OctaFX broker, it allows me keep trades on as long as I prefer without any worry at all while there are no charges too for this!
These patterns can be seriously good to help us with
trading, but at the same time, we need to be certain and be aware that there is
always risk in this. I use anything with strict risk and money management, so
that leaves me in comfortable shape and the biggest plus point is, I only
invest around 100 to 150 dollars which gets boosted by 50% bonus from OctaFX
broker, so this turn into any investment into huge and I can be free of stress
due to low investment.