Weekly Pullback Planning for SP500 and Dow Jones
Following up from the prior “Pullback Planning Update,” let’s take a quick look at the broader S&P 500 and Dow Jones to note the logical pullback (retracement) toward the rising weekly targets.
Let’s start with the S&P 500:

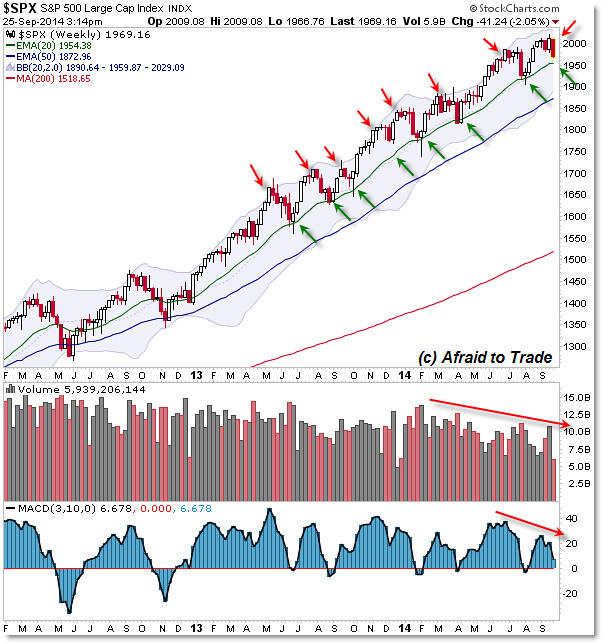
Focus our attention on the price, upper Bollinger Band, and rising 20 week EMA (green).
I highlighted each time recently (2013 to present) where price retraced into – and pulled back away from – the upper Bollinger Band and then traded back to the rising 20 week EMA as a target.
At this point, price is once again repeating this pattern where price is pulling down away from the resistance toward the rising 20 week EMA support target – it’s currently trading at 1,955.
Notice each time price has retraced to this level (as a target) and then rallied back to continue the stimulus-fueled uptrend.
We can’t assume price will repeat the pattern with 100% accuracy, but we will reference the 1,955 level as the key pivot where we’ll plan aggressive bearish strategies (deep pullback that could target 1,900) underneath the level and continuation of the stimulus-fueled uptrend above 1,955.
The logic is similar in the Dow Jones Industrial Average:

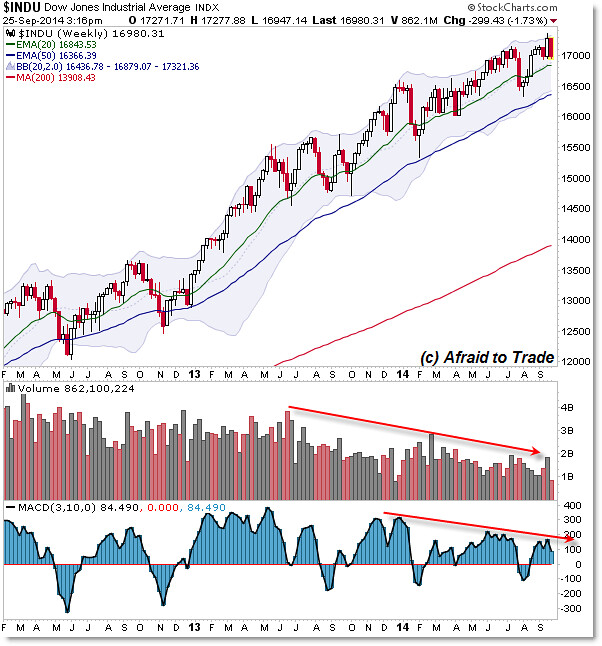
The pattern repeats in the Dow Jones average and the key level we’ll be highlighting as a potential downside sell targeT (initially) is the rising 20 week EMA at 16,850.
Note that the Dow – unlike the S&P 500 – has fallen under the 20 EMA to find spike-intervention support (reversal candles) at the rising 50 week EMA.
Among all the other indicators you can study, focus your attention at least for a moment on the rising 20 week EMA targets.
Follow along with members of the Daily Commentary and Idealized Trades summaries for real-time updates and additional trade planning.
Corey Rosenbloom, CMT
Afraid to Trade.com
Follow Corey on Twitter: http://twitter.com/afraidtotrade
Corey’s book The Complete Trading Course (Wiley Finance) is now available along with the newly released Profiting from the Life Cycle of a Stock Trend presentation (also from Wiley).


2 Comments
Comments are closed.