What Two Breadth Charts are Saying about the Current SP500
Is a reversal developing in the stock market?
Let’s listen to the message from two charts of stock market breadth.
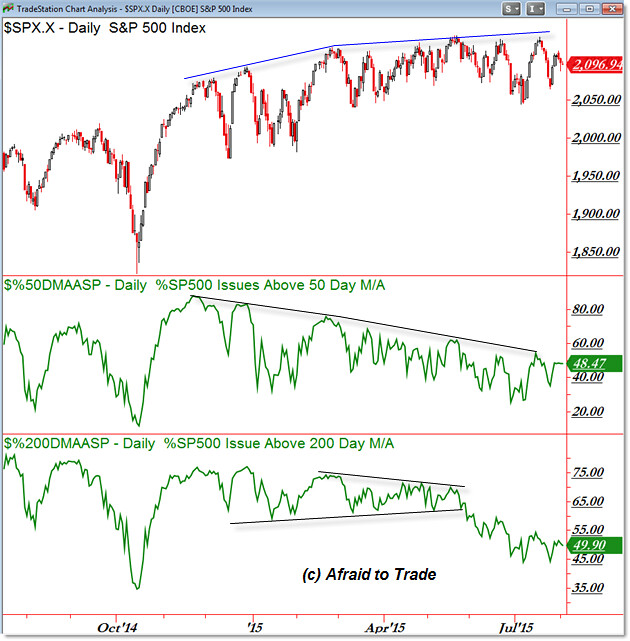
We’ll start with the Percentage of Stocks above Key Moving Averages:

The chart above shows the Daily S&P 500 Index with two indicators:
The percentage of stocks (in the S&P 500) above their 50 day Simple Moving Average (SMA) and the percentage of stocks above their 200 day SMA.
Generally, a strong rising market will show a large percentage of stocks above key moving averages; a weakening market will show deterioration of stocks above these averages.
For now, we saw broad strength in the late 2014 rally to new all-time highs, but since then (especially throughout 2015), the S&P 500 Index crept (or limped) higher while fewer stocks remained above these key averages.
At present, 48.5% of stocks in the S&P 500 are above their 20 day SMA while 50% of stocks are above their 200 day SMA.
If you’re a super bull expecting this trend to continue higher indefinitely, this is not the message you want Breadth to whisper to you.
Let’s see another perspective of Breadth – stocks at new 52-week highs and lows:

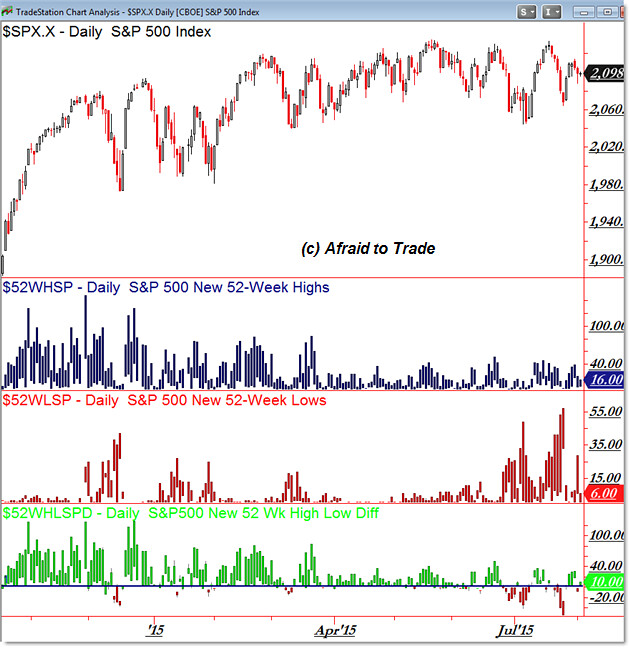
The S&P 500 Chart above shows three indicators: Stocks at New 52-Week Highs; New 52- Week Lows, and the Difference.
Once again, note that in late 2014, more stocks were making new 52-Week Highs (a sign of strength) while a handful of stocks were making fresh 52-week lows.
Note the concentration of green bars (on the lower chart – the Difference) as we entered 2015.
However, as 2015 continued – and stock prices continued inching their way higher – Breadth weakened.
You can see the pure number in the blue chart of Stocks at New 52-Week Highs – it’s declined through 2015.
What concerns me most – other than the lengthy divergence – is the spike in the red graph which indicates S&P 500 Stocks making New 52-week Lows.
Note how the number spiked rapidly from the 5 to 10 level (before July) to the present 55 level in July.
This means that during the recent pullback in stock prices, 55 stocks made new 52-week lows.
For now, continue monitoring breadth and the performance of larger, leading stocks (which can hold up a broader market index) against the participation of the other stocks we rarely see discussed.
Unless the situation reverses back to the bullish side quickly, we’ll heed the message of Breadth which suggests caution ahead.
Follow along with members of the Afraid to Trade Premium Membership for real-time updates and additional trade planning.
Corey Rosenbloom, CMT
Afraid to Trade.com
Follow Corey on Twitter: http://twitter.com/afraidtotrade
Corey’s book The Complete Trading Course (Wiley Finance) is now available along with the newly released Profiting from the Life Cycle of a Stock Trend presentation (also from Wiley).


If we want to be successful in this Forex world then I believe having mastery over reading the charts can be very handy, I very lucky to be working with OctaFX broker, it’s an outstanding company with having great features which includes cTrader platform, so trading with this makes thing so much easier due to having upgraded system which makes reading the chart so much easier while there is also 24/5 support service available to help us out with everything!