A Flag and a Breakout for Tesla Motors TSLA
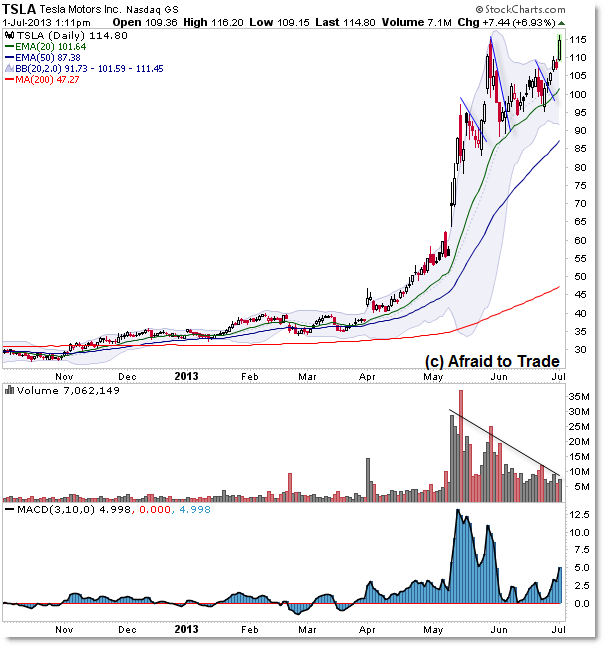
Tesla Motors (TSLA) shares continued their strong uptrend today with a breakout from a triangle pattern or a daily Bull Flag to push to all-time highs.
Let’s take a look at the Daily Chart, note the trend, and then highlight the lower frame patterns and levels to watch.

The Daily Chart shows us the very strong uptrend that accelerated with the April 2013 breakout and continued with the May breakout as volume surged along with price (a sign of strength or confirmation of the higher prices and uptrend).
When volume accompanies price, it tends to suggest even higher prices yet to come – our best strategy tends to be buying shares on pullbacks or retracements to rising moving averages or trendlines.
I highlighted three such pullbacks or “flags” that developed after May’s stellar breakout, all of which triggered an aggressive entry into the rising 20 day EMA or a conservative “prove it to me” entry on the intraday breakthrough above a hand-drawn falling “flag” trendline.
Today’s breakout and pro-trend upside action is a continuation of the bullish action and as long as buyers can hold these levels, it suggests even higher pro-trend price action may yet be in store.
Let’s take the daily chart bullish trend into account and now drop to the 15-min intraday chart for clarity:

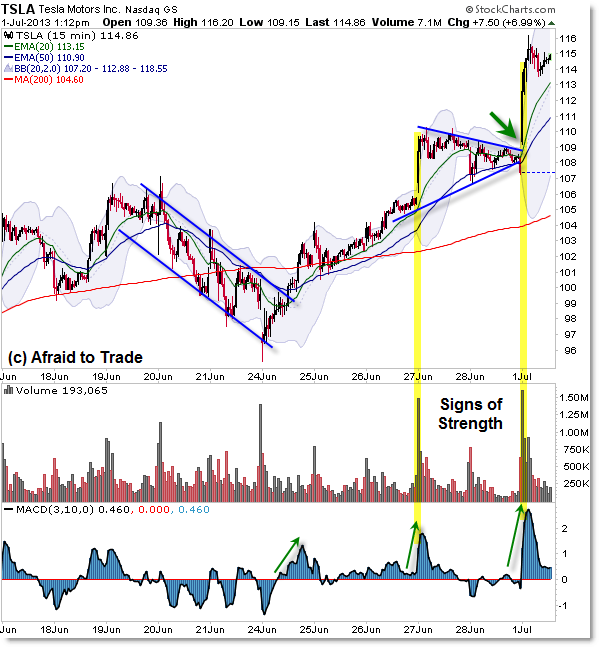
Note the June 19 to 24 period of an intraday “falling parallel trendline channel” or Bull Flag that resulted in a breakthrough trade opportunity not just above the falling ‘flag’ trendline, but the $100 “round number reference” price.
Short sellers – those who hope to profit from a decline in the value of a stock – tend to place stop-losses above known resistance levels (such as trendlines or round numbers) where they think price “should not” break through.
In the event price does break above such levels, these short-sellers will buy-back to cover their losses which aligns their purchases with buyers or bulls who are also buying shares because of a pattern (flag) or trendline breakthrough.
Either way, this breakthrough activity tends to create a short-term impulse or feedback loop (sellers buy to cover losing positions; buyers buy to enter or add to existing positions). These events create profit opportunities for short-term traders.
We see a similar breakout event above the $115 per share ($114.90) all-time high achieved during a strong opening – yet short-term ‘exhaustion’ – gap on May 29, 2013.
We also note the two spikes in both volume and momentum (June 27 and July 1) as further signs of confirmation of the bullish price trend (strength in volume and momentum).
Note the bullish breakout this morning above the “Symmetrical Triangle” price pattern which set the stage for today’s strong upside rally and breakout event.
Traders should continue to focus on the $115 and $116 price levels as a key pivot wherein “unexpected” stop-losses of the buyers will trigger while “unexpected” stop-losses will continue to trigger from the short-sellers as price continues trading higher away from the $115 breakout level.
Take a moment also to study “Bull Traps” from three recent events and be on guard for a potential trap should price suddenly break under $115 and fall sharply away from this key inflection point.
Join fellow members to receive daily commentary and detailed analysis each evening by joining our membership services for daily or weekly commentary, education (free education section), and timely analysis.
Corey Rosenbloom, CMT
Afraid to Trade.com
Follow Corey on Twitter: http://twitter.com/afraidtotrade
Corey’s new book The Complete Trading Course (Wiley Finance) is now available along with the newly released Profiting from the Life Cycle of a Stock Trend presentation (also from Wiley).

The analysts are personally optimistic about Tesla, it goes without saying that the stock is as volatile as the company is groundbreaking