A Quick Example of TICK Deterioration and Intraday Reversals
For intraday traders of stocks, ETFs, or index futures, it can be very advantageous to compare mini-trends in the NYSE TICK with the S&P 500 (or Dow, NASDAQ, or Russell 2000).
One main way of studying TICK Trends is to spot a clear deterioration or visual trend divergence with price (the index) and the NYSE TICK or related Market Internal.
Today’s session gave us a clear educational example of this concept and how it can be very helpful to identify ahead of intraday trend reversals.
Let’s see how a reversal in the Trend of TICK gave clues of a likely – and eventual – reversal in price itself.
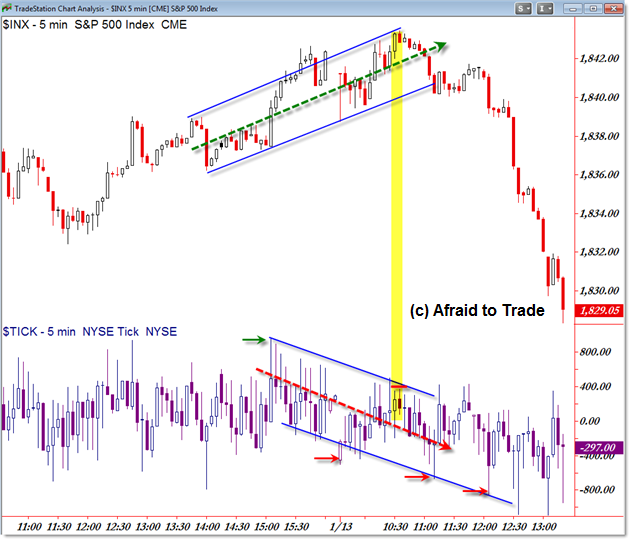
We’ll start with the 5-min intraday chart:

I’m cheating by showing you the outcome of the example, but keep this broader picture (set-up and outcome) when studying the 1-min chart.
We compare TICK Highs and Lows to corresponding Price Highs and Lows for signs of confirmation (which suggests trend continuity as of what occurred at the end of January 10 with the new TICK and price high above 1,840) and non-confirmation or divergence (which suggests caution and possible trend reversal).
Note how price pushed to a new swing high above 1,842 in the S&P 500 only to be met with a deterioration (decline) in not just TICK highs but also TICK lows.
Pay special attention to the uptrending price channel I drew which corresponds directly with the declining TICK channel.
A small “Head and Shoulders” pattern developed into 1,840 and on the trigger-breakdown, price reversed and collapsed into a new intraday downtrend.
Note also the progression of ongoing TICK highs and new lows throughout the pattern as price fell impulsively from 1,840 to the 1,830 level.
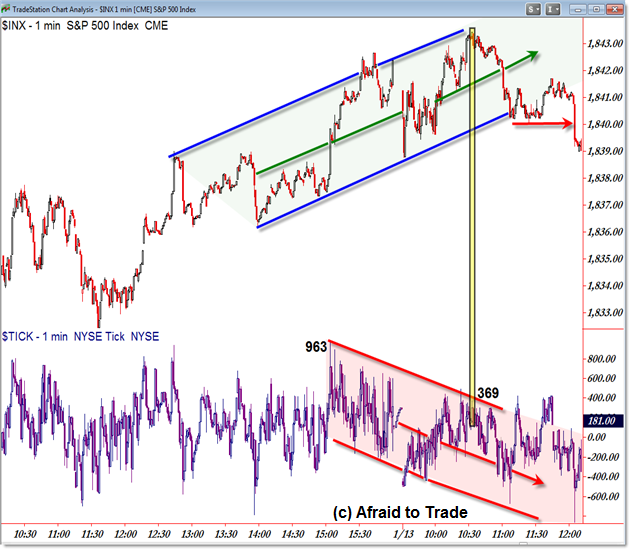
Let’s study the pattern as it developed in real-time as seen on the 1-min chart:

Again, even if you don’t trade the intraday or lower frame charts exclusively, it can be helpful to monitor these charts for signs of clear divergences or TICK Deterioration as we saw this morning.
The 1-min chart provides more detail – more bars – to see the structure develop in real-time.
At the end of January 10, TICK pushed to an intraday high of +963 but note the deterioration in TICK into the close (it developed in the form of lower TICK highs relative to new intraday price highs at the close of Friday’s session).
We opened this morning’s session with a slight gap down (and new intraday TICK lows under zero) but the important factor to note is the push up to the +400/+500 level during the morning upside price action.
We would expect TICK to join price at new highs – anything less is a divergence and form of non-confirmation that argues for caution (it does NOT guarantee a reversal).
The reversal thesis developed with the persistent divergence – reversal in intraday trend – of TICK relative to the uptrending channel in price.
In fact, at the intraday high (seen only in hindsight), TICK registered a corresponding high of 369 (ironically). While we can’t guarantee this was the exact intraday high in real-time, the visual deterioration in TICK does tell us to avoid the long/bullish side if at all possible.
TICK continued to deteriorate with the push under -600 as price challenged 1,840 at 11:00am PST.
The official intraday short-sale and confirmed bearish reversal signal developed on the noon (PST) break under 1,840 which also triggered the Head and Shoulders price pattern.
Refer to the 5-min chart above to see what happened next (hint – an instant 10 point downside move toward 1,830).
Take time to study lessons like these and be quick to recognize similar developments as they occur in real time.
Follow along with members of the Daily Commentary and Idealized Trades summaries for real-time updates and additional trade planning parameters as we watch a “hold and bounce” or “break and retrace” scenario play out in the near future.
Corey Rosenbloom, CMT
Afraid to Trade.com
Follow Corey on Twitter: http://twitter.com/afraidtotrade
Corey’s new book The Complete Trading Course (Wiley Finance) is now available along with the newly released Profiting from the Life Cycle of a Stock Trend presentation (also from Wiley).


3 Comments
Comments are closed.