Are You Watching this Monthly Price Level on Google GOOG?
It’s often helpful to pull the timeframe back to see what the weekly and sometimes monthly chart are showing about popular or volatile stocks.
That’s especially the case right now in Google (GOOG). Have you seen its monthly chart lately?
Let’s take a quick look:

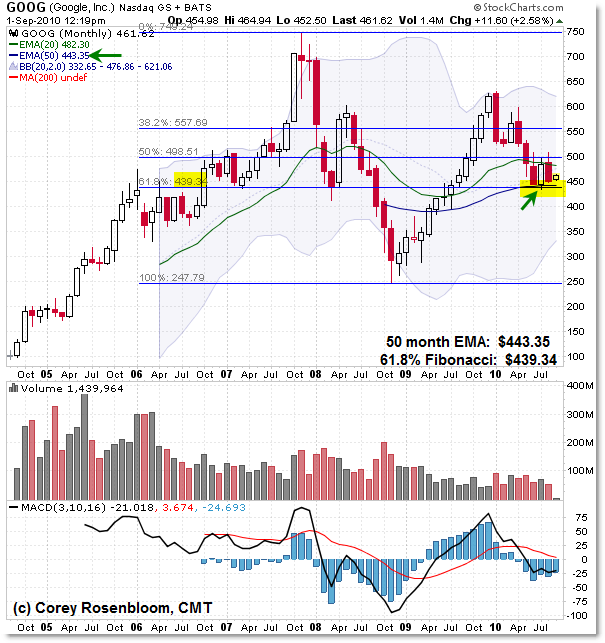
A quick glance shows us a double chart confluence at the $440 price level – that’s your reference level going forward.
The 50 week EMA rests at $443.35 – but that’s not as important perhaps as the 61.8% Fibonacci retracement as drawn at the $439.34 level.
The $440 level is also a price polarity point (fancy word for “it’s been both support and resistance”) from the closing low of March 2008 and March 2007 – as well as a level of resistance in 2006.
Interestingly enough, volume has been steadily trailing lower and lower over time, and that doesn’t appear to be a factor of stock price if you look closely.
As is the case with Apple (AAPL) and many other high-flying stocks, volume tends to be very heavy when the share price is low (people purchase more shares for positions) and then decrease as the share price becomes more expensive.
Google has swung up to $750, down to $450, back to $625, and now down to $450 and during the whole time, volume has steadily trailed off.
The volume spikes in the scenario came in during the sell-phases in late 2007 and late 2008.
Going forward, watch for bulls to support price at the $440 level, and if bears can push price to close strongly under $440, then we have a lot of room to the downside.
For reference, overhead monthly resistance appears to be a loose zone at $500 – that’s the 20 month EMA at $482 and the 50% Fibonacci line at $498.
Corey Rosenbloom, CMT
Afraid to Trade.com
Follow Corey on Twitter: http://twitter.com/afraidtotrade
