Gold Threatens Fresh Breakdown into Open Air
Gold prices rest on the final support precipice of a downside “Open Air” Pocket that could trigger very soon.
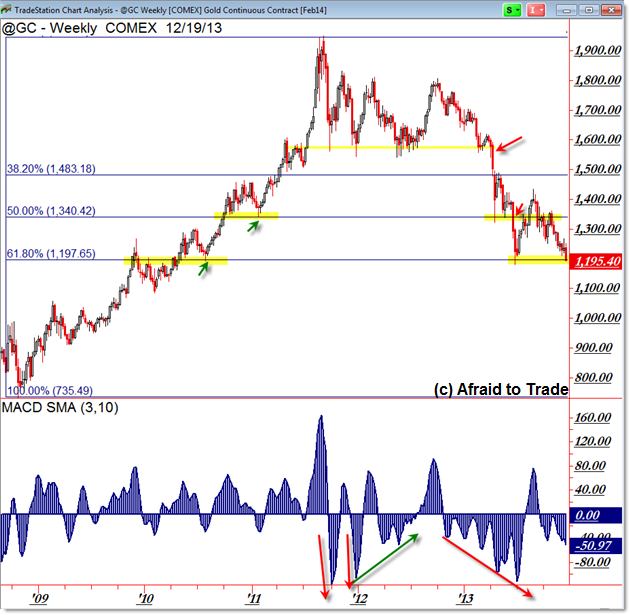
Let’s study the structure, Weekly Fibonacci Grid, and critical confluence “make or breakdown” support:

From the 2008 low (ahead of the March 2009 stock market low), I drew a Fibonacci Grid on the @GC Continuous Contract (TradeStation data) which reveals important levels that have provided both support and resistance on the chart.
The key level now is the larger 61.8% Fibonacci Retracement into $1,197 – where gold challenges immediately.
Ultimately, buyers have their last chance to step in for aggressive ‘support-bounce’ plays before there stop-losses are washed out (triggered) should price move further down away from $1,200.
On the intermediate frame (weekly chart), a firm breakdown that sustains under $1,200 would target the prior swing low (2010) into $1,100 or more appropriately the horizontal overhead resistance during 2009 into $1,000 per ounce.
It’s worth stating that absolutely, price can achieve these targets should the downtrend persist. Remember, gold traded into $1,900 per ounce in the middle of 2011; it currently is struggling to hold $1,200 per ounce (few traders thought the current outcome was remotely possible in 2011).
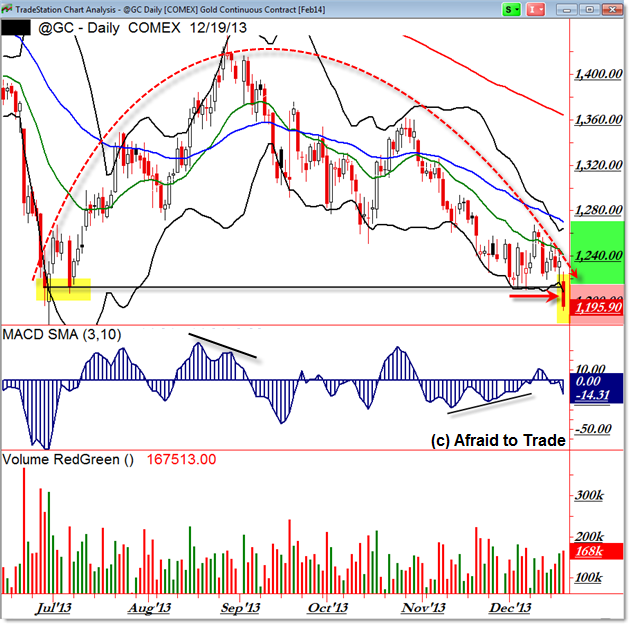
We can zoom-in on the Daily Chart for additional information and trading levels:

We see an “Arc Trendline” Structure taking price up from $1,200 in July 2013 to the present “make or break” retest of the low in December.
See my prior post “Amazon and the Parabolic Trendline Arc” for a plethora of links to prior educational posts/examples for the “Arc Trendline” concept.
Generally, a retest of the prior low completes the “Mirror Image” pattern and support can hold for a reversal bounce.
However, should support fail – and remember support exists not just from the 2013 low but from the 61.8% Fibonacci Retracement (weekly chart), then gold would break down to new chart lows and we’d need to use the Weekly Chart for downside reference targets.
Yes, a positive momentum divergence and reversal candles (daily chart) suggested a successful bounce-up off $1,200 but today’s candle tips the chart toward the breakdown threshold.
Perhaps the worst case scenario would be a “Bear Trap” outcome where gold initially trades sharply under $1,200 then reverses just as powerfully to trade back above it.
See prior educational examples of Traps and how to handle them:
“Lessons from the August SP500 Bull Trap”
“Quick Lessons from Three Bull Trap Outcomes”
We’ll need to watch today’s close and the next trading sessions very closely, fully ready to trade either outcome.
Follow along with members of the Daily Commentary and Idealized Trades summaries for real-time updates and additional trade planning parameters as we watch a “hold and bounce” or “break and retrace” scenario play out in the near future.
Corey Rosenbloom, CMT
Afraid to Trade.com
Follow Corey on Twitter: http://twitter.com/afraidtotrade
Corey’s new book The Complete Trading Course (Wiley Finance) is now available along with the newly released Profiting from the Life Cycle of a Stock Trend presentation (also from Wiley).

