Charting 10 Dow Jones Stocks in High Volatility Breakdowns
While many stocks are seeing downside selling pressure in 2014, let’s take a closer look at those select names in the Dow Jones Industrial Index – Blue Chip Stocks – which are making larger than normal breakdowns.
To quantify “larger than normal,” I ran a stock scan for stocks that have moved 6 times their average daily true range (ATR) away from their recent swing high.
These stocks are a combination of “low volatility into high volatility” (breakout) and also sustained price movement away from their prior high.
Let’s take a quick ‘scan’ look at these names and use them for possible candidates:
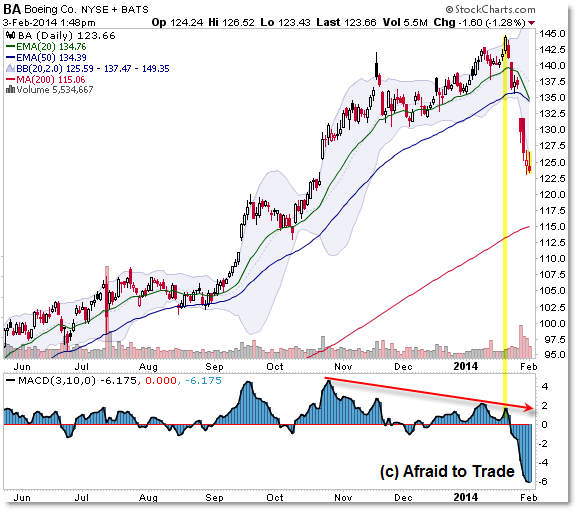
Again, for inclusion in this scan, a stock must move at least six times the current ATR away from its prior price high.
For example, Boeing (BA) above registered a price swing high near $145 per share in mid-January.
The current daily chart ATR (Average True Range) value at the time was roughly $2.00 per share.
A sell-swing from the $145 peak to the current $123 level resulted in a $22 sell swing which is roughly 10 times the average true range.
For reference, after the sell-swing, the current ATR value is roughly $3.00 per share, and by this updated calculation, BA is still roughly 7 “ATRs” straight down from its $145 peak.
Keep in mind that the “Average True Range” reflects the volatility – daily price movement – over the last 14 days. A stock moving multiple “ATRs” in the same direction indicates a quantifiable measurement, especially when we compare “ATR Multiples” of other stocks.
The following stocks have all moved at least 6 times their daily ATR value away from their prior high which indicates a sustained movement in the same direction – it calls our attention to these Dow Jones names.
Chevron Corp (CVX) not only moved down from its $125 high, but also broke free of its $166 per share horizontal trading range (rectangle):

General Electric (GE) is a low volatility stock (daily ATR near $0.30) yet it has moved sharply down from the $28.00 high to the key $24.50 focal point:

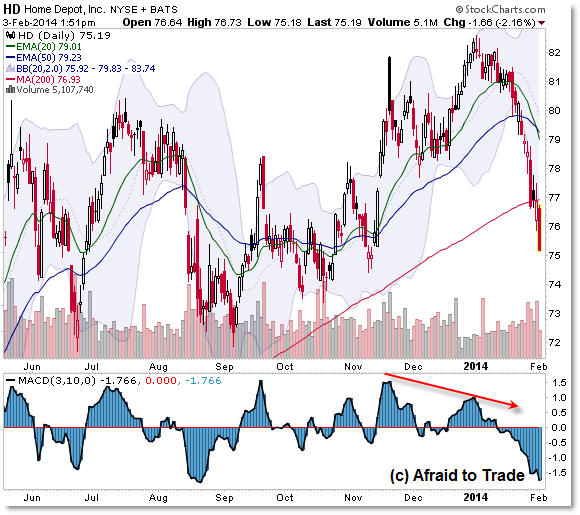
Home Depot (HD) triggered a “Bull Trap” above $81.00 per share only to collapse back into its range:
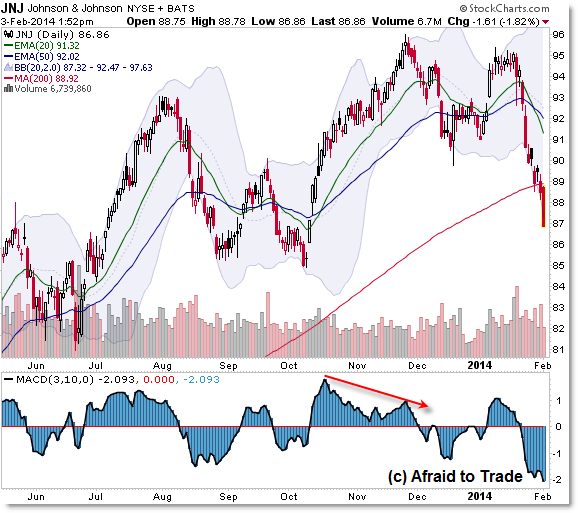
Johnson and Johnson (JNJ) is a “Defensive Stock” yet it has collapsed with other stocks:
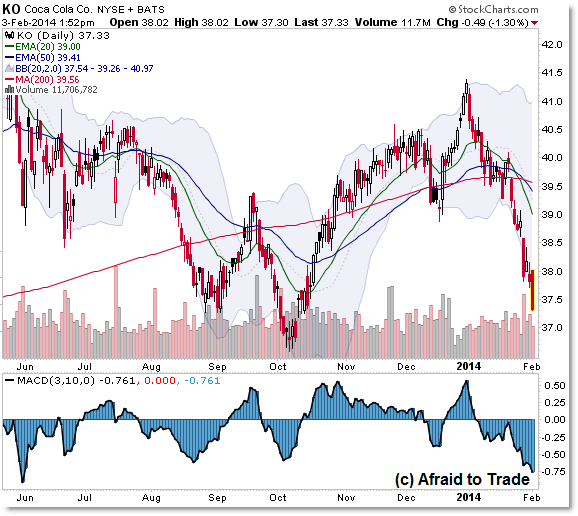
Coca-Cola (KO) is completing a “Mirror Image Foldback” or retracement of the late 2013 rally:
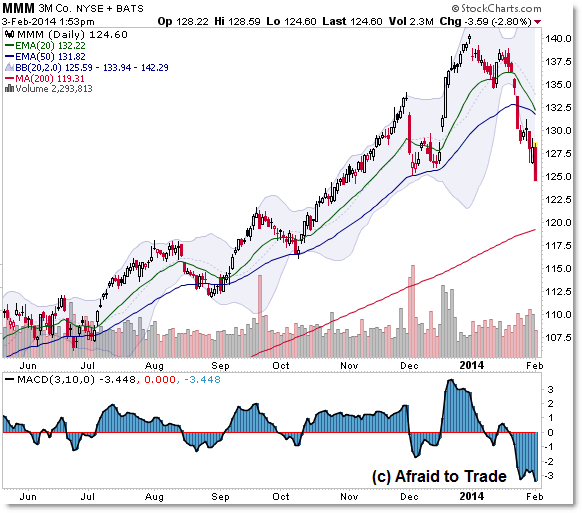
3M (MMM) showed relative strength in 2013, only to reverse sharply in early 2014 – trapping buyers:
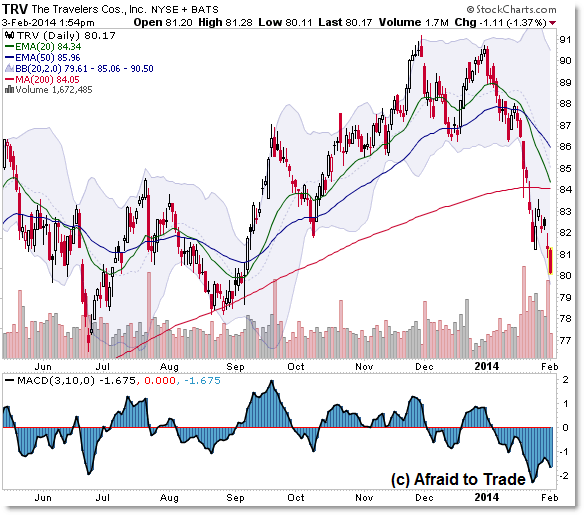
Travelers (TRV) failed to hold a breakout above $90 and has now sold-off sharply into $80:
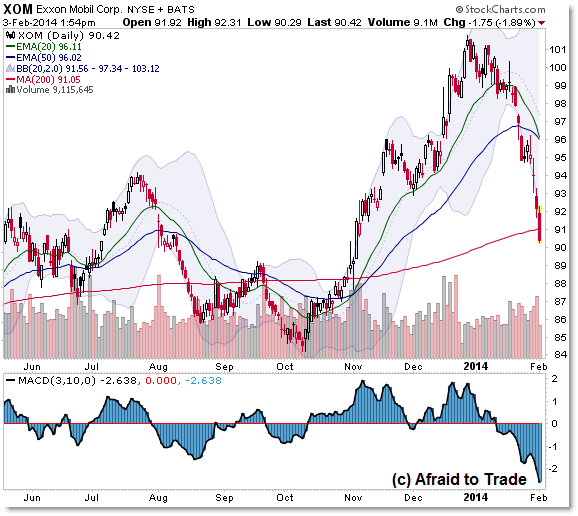
Exxon Mobil (XOM) showed relative strength from October to December, only to break sharply lower straight down to $90:
Wal-Mart (WMT) similarly gained from October to December only to give it all back into 2014:

These 10 names are making the largest sustained impulses down away from their recent highs.
This is just one of many stock scans that help call our attention to candidates we might not otherwise discover.
Follow along with members of the Daily Commentary and Idealized Trades summaries for real-time updates and additional trade planning parameters as we watch a “hold and bounce” or “break and retrace” scenario play out in the near future.
Corey Rosenbloom, CMT
Afraid to Trade.com
Follow Corey on Twitter: http://twitter.com/afraidtotrade
Corey’s new book The Complete Trading Course (Wiley Finance) is now available along with the newly released Profiting from the Life Cycle of a Stock Trend presentation (also from Wiley).


2 Comments
Comments are closed.