Charting Copper and JJC May 24
Copper, being used primarily as an industrial metal, can be a good gauge for broad economic activity, and thus helpful in making comparisons with the S&P 500.
Let’s take a quick look at copper prices – daily chart – over the last few months as well as the popular Copper ETN under symbol JJC.
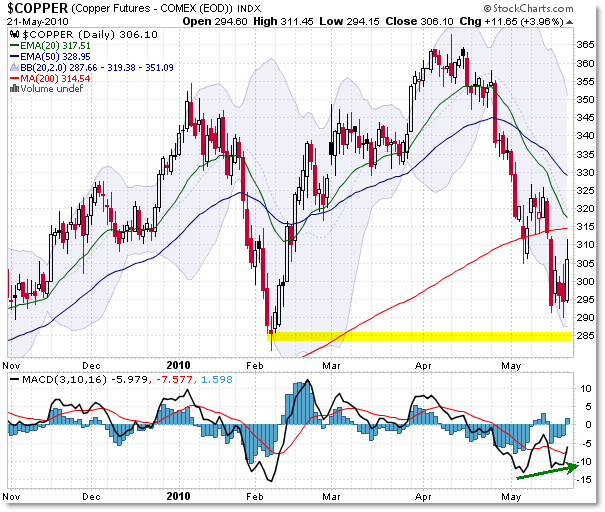
First, Copper (futures) index prices:

Copper prices, while not exactly mirroring the S&P 500, are in close resemblance with the broad market index in price structure.
However, copper prices had a slight lead on the S&P 500 recently, peaking at the 365 index level on April 5, 6, 12, and 15th. The official top – a spike – was on April 12th.
In contrast, the S&P 500 peaked officially on April 26th, more than a week later than copper peaked.
Copper prices formed a similar three-wave sell-off pattern like stocks so far, bottoming one day ahead of the S&P 500’s Friday spike low off the February 2010 closing low.
The index, like the S&P 500, has overhead moving average resistance at the 315 level currently – let’s watch to see what happens there.
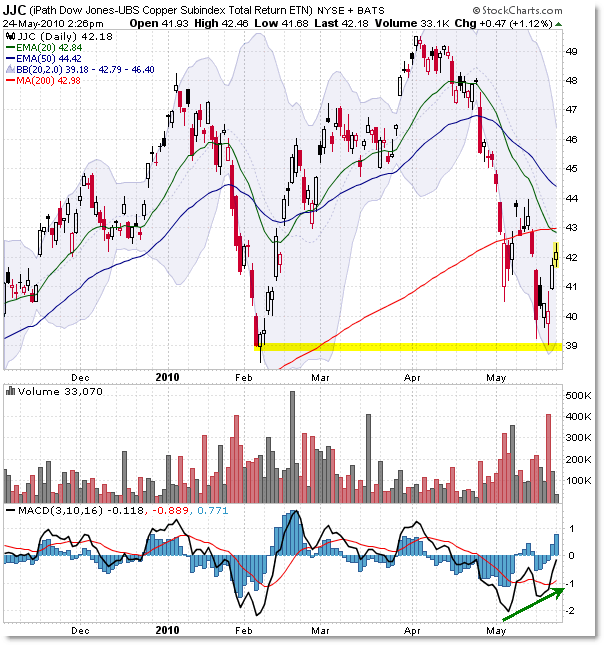
Next, the ETN JJC:

The ETN is a tradeable vehicle for investors looking for exposure – or speculation – in the copper markets … without using futures contracts.
JJC actually peaked at $49.50 on April 5th, well in advance of the S&P 500 peak on April 26th.
JJC also bottomed Thursday, instead of Friday for the S&P 500, off of the horizontal “prior price close” support level at $39.00 per share.
The confluence EMA resistance for JJC rests at $43 and then $44.
Unlike gold, which has a wider range of usage by investors (as a store against inflation and a source of protection in times of high risk), copper does not share the same qualities as its ‘precious metal’ cousin.
An investor is less likely to rush to buy copper when economic times are troubling; copper serves more as an industrial metal in manufacturing, and thus can be a good barometer of economic demand for the metal.
Keep watching copper prices as they may continue to give slight leads on the economy and broader equity markets.
Corey Rosenbloom, CMT
Afraid to Trade.com
Follow Corey on Twitter: http://twitter.com/afraidtotrade

do you concern 20 days ma cross over 200 days ma
It was credit tightening in China that turned JJC down. Copper had been on a rally related to carry trade investing and industrial/commercial demand in China, but the Bank of Japan turned of the credit liquidity and copper fell rewarding those who were short this ETN, or short base metals, or short basic material stocks..
Donald H. Gold in April 14, 2010 article entitled Investors Business Daily in article China ETF Sputters As
Gov't Tightens Money relates “China is booming. Its biggest problems now, say Beijing officials, are inflation and potential asset bubbles. With these in mind, the People's Bank of China has already started to tighten monetary policy.
Banks have seen increases in the reserve requirement, the percentage of deposits they must hold in cash. Interest rates have been ticking higher. And Beijing has persuaded banks to raise their lending standards.
When Beijing talks, the banks listen. The government owns controlling interests in the country's biggest banks. Beijing used this influence to spark a flood of aggressive bank lending as the global financial crisis threatened China's economy. China's market is sputtering, waiting to see if a tapping of the brakes will be enough to deal with a potential overheating.”
The China ETF, FXI, turned down April 14, 2010 just after JJC actually peaked at $49.50 on April 5th.
Notice how it has risen to resistance — that which was support will now provide resistance.
World wide growth opportunities seem limited; credit is tightening; fear has grabbed the markets; JJC is not a good investment.