Exploring the Emini Extended Run Volume Profile Chart
Will we ever get a pullback in this extended market? It sure feels like we won’t.
In the event that we do, what does the Volume Profile Chart reveal about the levels to watch?
I’m so glad you asked!
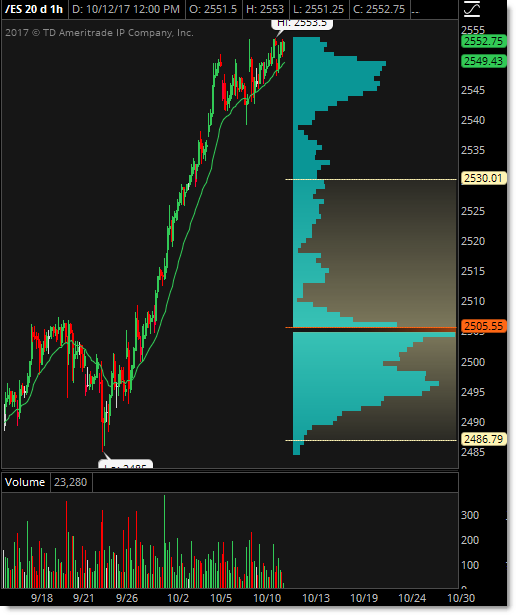
With the market running strongly up away from the prior consolidation zone, there’s very little in the way of volume support nodes after the breakout beyond 2,505.
A small volume “hump” (distribution) node occurs just beneath 2,549 where the market trades currently.
We’ll use this as our short-term focal point for intraday trades.
For swing traders, however, the next low price target in terms of the Volume Profile is our new 2,505 level along with our old (prior) 2,495 level as seen from the red line (highest volume node) and distribution.
What’s the plan here?
Continue ignoring every bearish indicator and logic itself UNTIL price ACTUALLY breaks beneath the steeply rising trendline and/or moving averages.
Only then can you play for lower targets on a pullback in this rare “extended run” environment.

Follow along with members of the Afraid to Trade Premium Membership for real-time updates and additional trade planning.
Corey Rosenbloom, CMT
Follow Corey on Twitter: http://twitter.com/afraidtotrade
Corey’s book The Complete Trading Course (Wiley Finance) is now available along with the newly released Profiting from the Life Cycle of a Stock Trend presentation (also from Wiley).”