Market Still Holding at the Extended Highs October 11
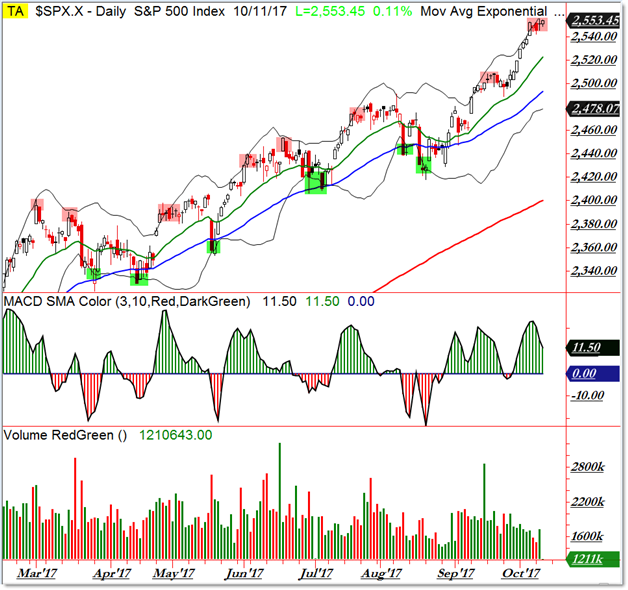
Stocks continue to hold the highs at the 2,550 “Open Air” level on an extended upswing.
Here’s the quick chart update and the plan for the next immediate price swing:

As I share with members each night, we plan the next swing in price and then play that out – usually in terms of movement “toward” and “away from” key levels – either on a swing (Daily Chart) or intraday basis.
Right now, the price “failed” to pull back (retrace) sufficiently at the beginning of October (notice that the pattern has been pulling back from the upper Bollinger to the lower Bollinger and then moving back again).
This set the stage for an “Alternate Thesis” extended run or powerful short-squeeze.
We indeed got our powerful short-squeeze which propelled the market straight up through all-time highs toward where we are now at 2,550.
What’s the next expected simple plan?
Look back at the red highlights on the chart – reversal candles at the upper Bollinger Band in the uptrend – and plan for a pullback at least to the rising 20 day EMA again (green).
While that’s certainly the dominant thesis – and should be easy to see – YOU must plan for what you’ll do in the event the market extends the short-squeeze and continues in the lower-probability alternate thesis non-stop bullish swing in which we’re moving currently.
Follow along with members of the Afraid to Trade Premium Membership for real-time updates and additional trade planning.
Corey Rosenbloom, CMT
Follow Corey on Twitter: http://twitter.com/afraidtotrade
Corey’s book The Complete Trading Course (Wiley Finance) is now available along with the newly released Profiting from the Life Cycle of a Stock Trend presentation (also from Wiley).”

