February 2014 Scanning for Stocks Most Extended from 200 Day Moving Average
After the recent stock market sell-off, let’s update our current “Stocks Most Extended from their 200 Day Simple Moving Average” scan list to generate potential trading ideas that other scanning techniques may miss.
Here’s the Top Stocks Most Over-Extended from the 200d SMA at the moment:

You’re likely familiar with three of the strong stock names: Facebook (FB), Netflix (NFLX), and Wynn Resorts.
I recently posted about Facebook ahead of earnings – it’s an interesting read from the other side of the earnings gap higher from what was then support at the time.
I also detailed a “Parabolic Arc” pattern in strongly trending Wynn Resorts (WYNN) and we can see the outcome of that structure as well.
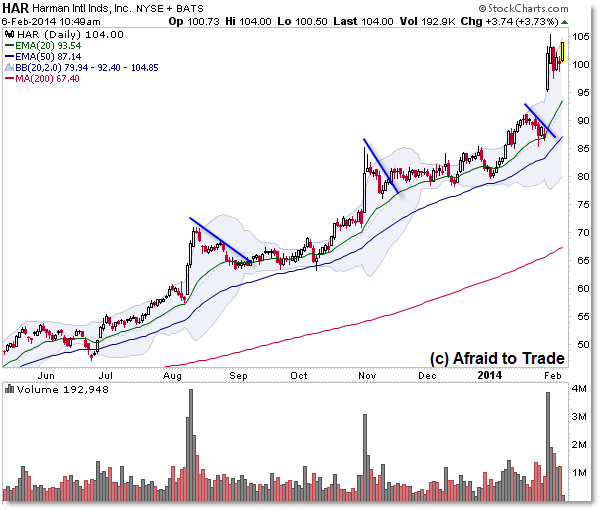
However, you might not be aware of strong trending stocks like Harman International (HAR) which not only sustained an uptrend, but gapped higher and continued rising, breaking the $100 per share mark again.
Note the clean “flag” retracements that occurred during the lengthy, stable uptrend:

While these six names above represent strong stocks above their 200 day SMA, let’s now look at the companion stocks falling and trading the greatest percent beneath their 200 day SMA:

There’s an interesting reversal on the list, especially if we include stock #6 which is GameStop (GME).
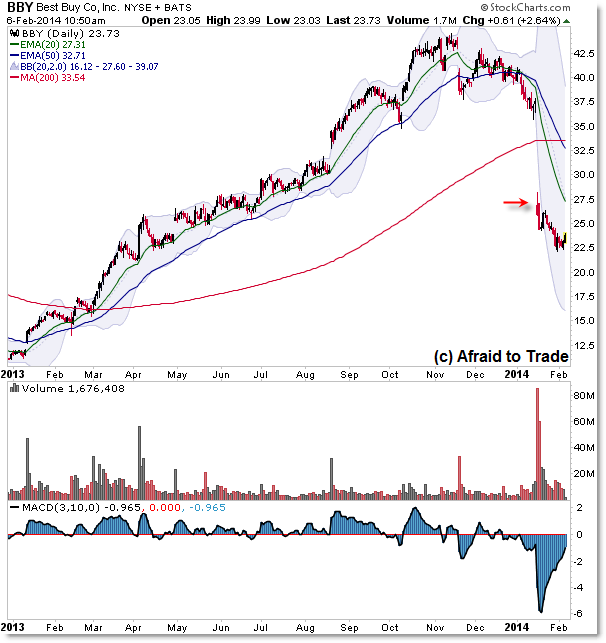
Best Buy (BBY) and GameStop both consistently made the list of most over-extended, strong trending stocks in 2013 only to flip to the weaker side on gaps and new emerging downtrends.
Let’s take a quick look at these charts:


Both stocks showed solid uptrending growth during 2013, rising to the top of the Relative Strength list at times, only to see price peak in November ahead of the holiday shopping season.
Stock prices have collapsed since the peak. Both stocks give valuable insights into trend reversals which is one of the main reasons to conduct stock scans like this.
There’s two ways traders can use this type of information to generate trading ideas.
The first is a “pro-trend” approach which takes into account strongly trending stock names (filter) and then seeks to buy shares into the trend, particularly on retracements or ‘flag’ patterns or even breakouts to new highs which is a more aggressive tactic.
The second approach is far more aggressive and seeks to play “anti-trend” or trend reversal strategies such as reversal positions. It’s essentially taking into account an over-extended stock and betting on mean reversion back toward the 200 day SMA.
Playing trend reversals is a risky strategy and is best avoided by new traders – trends tend to continue longer than most traders think they can.
Use these candidates to generate additional analysis and strategies.
For archives of how stocks have performed on similar “extended” scans, see any of the following:
Over/Under-Extended Stocks from September 2013
Over/Under-Extended Stocks from May 2013
Over/Under-Extended Stocks from February 2013
Follow along with members of the Daily Commentary and Idealized Trades summaries for real-time updates and additional trade planning parameters as we watch a “hold and bounce” or “break and retrace” scenario play out in the near future.
Corey Rosenbloom, CMT
Afraid to Trade.com
Follow Corey on Twitter: http://twitter.com/afraidtotrade
Corey’s new book The Complete Trading Course (Wiley Finance) is now available along with the newly released Profiting from the Life Cycle of a Stock Trend presentation (also from Wiley).

