Quick Lessons from the August SP500 Bull Trap
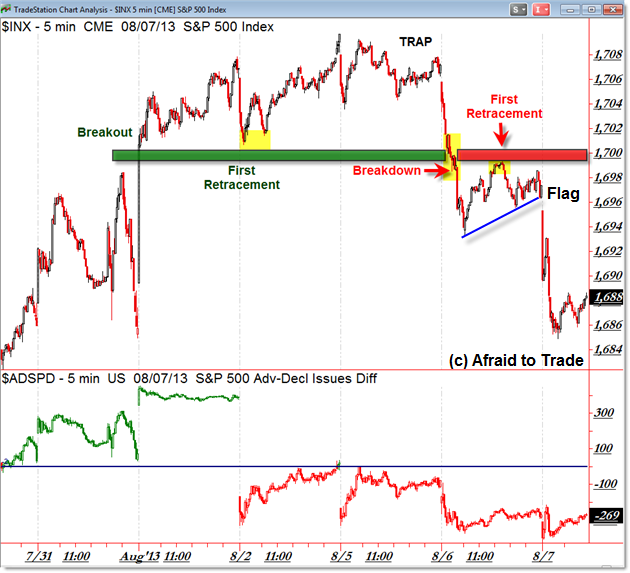
The market reversed course with an initial Bull Trap event after a breakthrough above the known 1,700 key index target level.
Let’s step inside the failed breakout, identify key factors that hinted at the reversal, and compare this outcome to recent Bull Traps.
Here’s the intraday SP500 index chart with Internals:

In general, a breakthrough above a known resistance target level is expected to generate higher volume, higher internals, higher participating, and higher excitement.
When price breaks a level and these factors do not occur, it gives us a clear warning sign that something is wrong with price and the breakout.
An initial breakout above resistance triggers the stop-losses of bears/short-sellers who hold tight stops above the level.
In addition, it often triggers buy-to-enter stops for buyers who want to participate early on a break of a resistance level.
Also, breakouts can be emotional decision points wherein a sidelined or cautious buyer/bull finally can’t take the pain of missing out and the executes a “get me in at any price” order.
These factors generally trigger on a break of a key level, particularly a known level, but the “buy reasons” need to continue to sustain a breakout. In other words, it’s up to all participants – bulls and bears – to keep the breakout going.
Objectively, a breakthrough above a known resistance level is a fact – it either happens or it doesn’t.
Once a breakout occurs, we then look specifically to…
- volume (is it higher than the recent average or lower),
- market internals (are they similarly spiking to new highs, confirming the breakout, or are they diverging and thus dis-confirming it?)
- price itself (are there multiple impulse or ‘buy’ bars or do we see price-bar overlap or choppiness)
Among other factors, these are the main chart-based factors to assess the probability of a breakout continuing or reversing (triggering a Bull Trap outcome).
If volume is lower than average, market internals diverge with price, and we see a consolidation/sideways price pattern as opposed to a straight-up impulse, it greatly increases the probability that the outcome (immediate future) will be that of a Trap as opposed to a sustained breakout.
The final piece of the puzzle is a return back under the breakout level – in this case 1,700 – which flips the supply/demand dynamic suddenly.
Buyers are trapped and thus forced to liquidate/sell while short-sellers who were stopped out may become emboldened and execute aggressive short-sell orders as the market moves further away (down) from the breakout level.
To further study recent examples of this important trading concept, see yesterday’s post highlighting the clear divergence of Market Internals with price along with two other recent posts on traps:
Updating Traps and Trendlines in Gold/GLD
Thoughts/Lessons on the June 21 Bull Trap in Crude Oil
Lessons from Three Bull Traps and Reversal Pathways
Failed Breakouts and Bigger Moves in the Opposite Direction
Join fellow members to receive daily commentary and detailed analysis each evening by joining our membership services for daily or weekly commentary, education (free education section), and timely analysis.
Corey Rosenbloom, CMT
Afraid to Trade.com
Follow Corey on Twitter: http://twitter.com/afraidtotrade
Corey’s new book The Complete Trading Course (Wiley Finance) is now available along with the newly released Profiting from the Life Cycle of a Stock Trend presentation (also from Wiley).


9 Comments
Comments are closed.