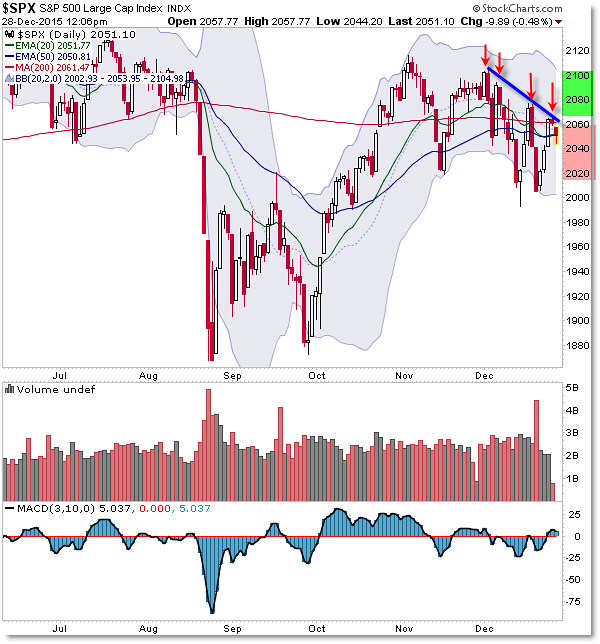
Gotta Watch this Important Trendline for the SP500
As we start this second holiday week to end 2015, we must build our trades around a key trendline.
Let’s pinpoint this key trading level and plan our strategies for the shortened week ahead:

As I highlighted for members this weekend (join for actionable trade analysis and strategy planning), our key focal point for this week would be the falling trendline as highlighted above.
The 2,060 level is our Power Pivot, making us BULLISH for a Breakout Higher but we’re seeing the trendline hold price at resistance, thus confirming our dominant thesis for a BEARISH Pullback (or retracement) down away from this key price pivot.
The bullish fly in the bearish ointment is the shortened holiday week ahead of New Years following last week’s “Santa Claus Rally.”
Use this trendline as a potential breakout trading opportunity IF price does break higher.
If not, then the trendline will remain dominant and price is likely to continue trading lower down toward lower targets such as 2,045, 2,020, then the full test of 2,000 again.
Follow along with members of the Afraid to Trade Premium Membership for real-time updates and additional trade planning.
Corey Rosenbloom, CMT
Afraid to Trade.com
Follow Corey on Twitter: http://twitter.com/afraidtotrade
Corey’s book The Complete Trading Course (Wiley Finance) is now available along with the newly released Profiting from the Life Cycle of a Stock Trend presentation (also from Wiley).


Looks very much bearish trend in place for happening, but if it breaks the resistance level then we might find things going very differently. At the moment, I am trading with OctaFX broker and they are simply awesome company to work with thanks to their low spreads of 0.2 pips, high leverage up to 1.500 plus having 50% bonus on deposit, it is trade able too which makes things work even better and allows my performance graph stay up all the time.