Great Bear Flag SPY Example but No Time to Act
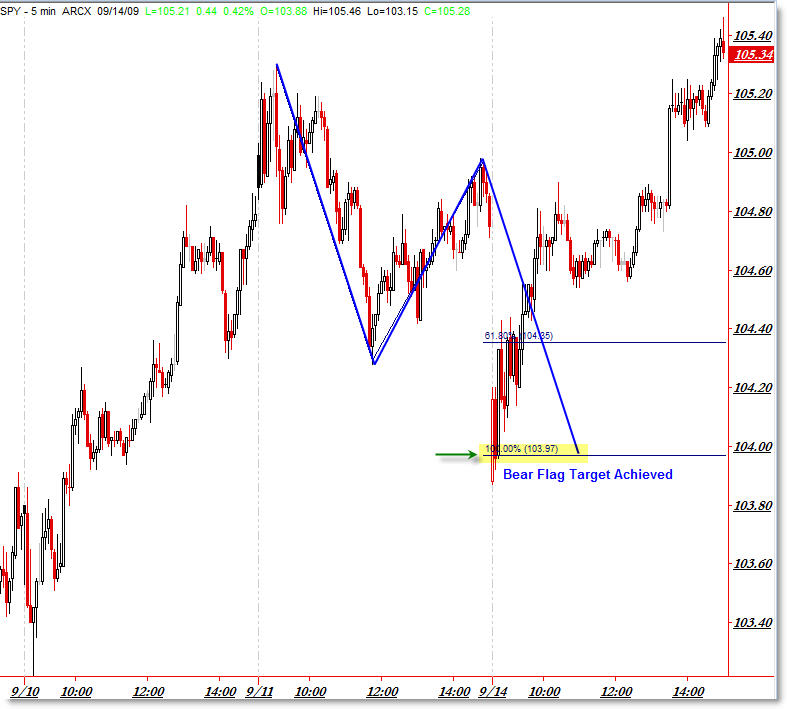
I wanted to highlight a strange conundrum that sometimes happens with classic technical analysis price patterns. Let’s take a look at a predicted “Bear Flag” pattern described on Friday that hit its target immediately upon this morning’s market open.
First, this is the chart I had presented to subscribers in my September 11th “Idealized Trades” report:
I described how I felt the intraday 5-min larger structure resembled a nice “Bear Flag” pattern (also known as an “AB = CD” Measured Move) which takes the distance of the “Pole” and then subtracts (projects) that down from the actual “Flag” (retracement) pattern.
You can read more about bear flags from our new Education Pages (a growing, free resource to readers).
I’m using the Fibonacci Extension tool to project the exact target price, which was roughly $104.00 ($103.96 in this example).
I figured – barring any major economic developments over the weekend – we could trail lower in price and then test (target) this level intraday on Monday.
Upon this morning’s open, the target was immediately hit in the SPY (of course, it did trail there in the futures market, allowing opportunity there), which gave ETF traders no opportunity to enter short and profit from this pattern.
Let’s take a look at a chart from today’s Idealized Trades report, summarizing the outcome of this flag:
Look at the price, as opposed to the “symmetry” of the blue lines (which would have made for a more ‘perfect’ Bear Flag).
The gap-down tagged this level, as price began rallying strongly higher to close the gap. Many times, the target price – as seen above – of a bear (or bull) flag becomes a support zone and can allow a “flip and reverse” entry.
I wanted to highlight this example as one of the reasons making money in the market can be difficult/frustrating.
Even when you correctly assess an exact target, the market has a tendency to achieve that target before you can do anything about it!
Still, I hope you were able to profit from the rise that formed off this support zone, which also was a classic (though larger than normal) “Gap fade” trade.
For end-of-day summaries, educational “teaching moments,” and discussions on what’s likely ahead for the next trading day (as seen above), please subscribe to or learn more about our “Idealized Trades” expanded premium subscription service at only $27.00 per month.
The more we see these examples and patterns, the better (and more confident) we’ll be able to trade them in real time!
Corey Rosenbloom, CMT


I'm a subscriber and way to nail that Flag from Friday….As soon as I saw the large bullish candlestick on the open, I went long based on what you projected from Friday……
I saw the lunch time as a triangle consolidation that broke to the upside?? At least it looked that way on the 1 min chart!
Big fan of your work….thanks for all you do!
Thanks Jeff!
I was disappointed that no one got to take advantage of the likely flag that developed!
But that's what's helpful about patterns – the target is often a support or “flip and reverse” point as this example showed us.
More than the triangle you mentioned (which worked well), it actually resolved into another bull flag (or AB = CD) up to get its target into resistance. These charts show why bull/bear flags are my favorite patterns!
Glad to have you as a subscriber! All the best to you!