Impressive Emini Rally and the Volume Profile Level to Watch
With the stellar rally in the market taking us to new all-time highs, what level appears as our Volume at Price pivot?
Let’s update our chart – hint: it hasn’t changed – and take a look now.
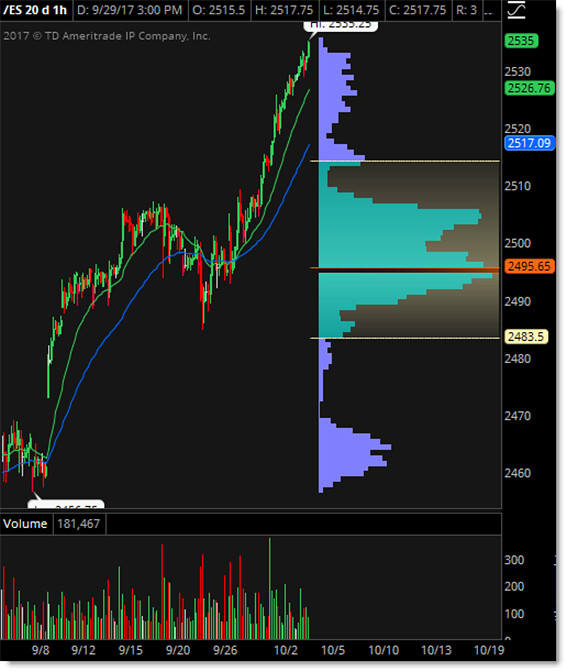
We’ve consistently seen the market print the 2,495 level as the “Volume Node” via our Volume Profile Chart.
With the market screaming higher, it’s done so quickly without time to digest price or volume.
This means we have an “Open Air” pocket beneath the market in the event we ever get a pullback (it feels like we never will).
However, one of two things MUST happen now:
Either price forms a new Value Area or Trading Range (consolidation) at the highs and thus the Volume Node (red line) rises to meet the new accepted or balanced range…
or price crashes through the rapid “sugar high” action on low accepted volume BACK toward a level of price and volume acceptance.
That level on the chart – as seen through the prior price consolidation and the Volume Profile – is the 2,495 level.
Plan your trades accordingly and be safe.

Follow along with members of the Afraid to Trade Premium Membership for real-time updates and additional trade planning.
Corey Rosenbloom, CMT
Follow Corey on Twitter: http://twitter.com/afraidtotrade
Corey’s book The Complete Trading Course (Wiley Finance) is now available along with the newly released Profiting from the Life Cycle of a Stock Trend presentation (also from Wiley).”