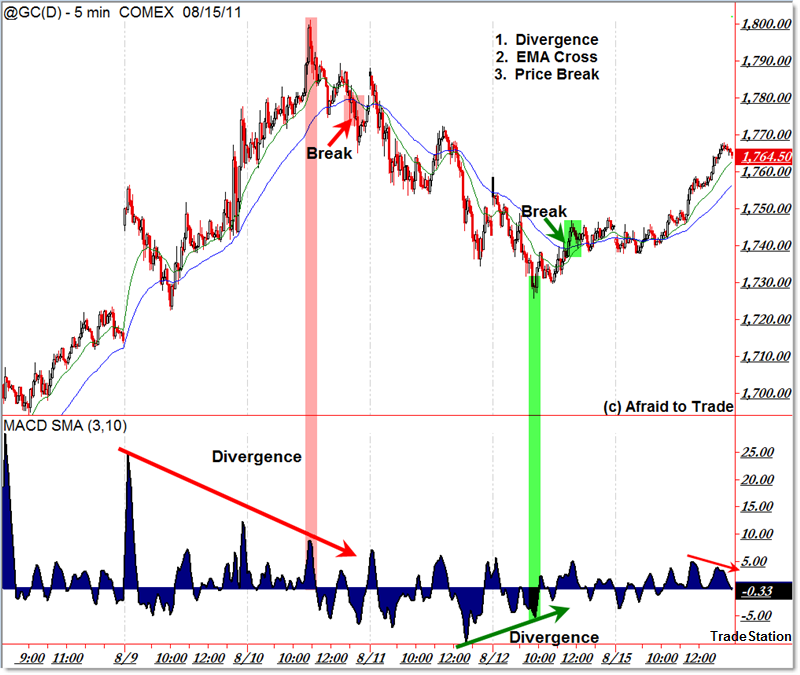
Lesson on Intraday Divergence Reversal Signals in Gold
I wanted to follow-up from the post “Lessons from Gold’s Three-Push Divergence into $1,800” from last week with an additional trading example of how to piece together the chart puzzle into a successful low-risk, high probability trade on the very short-term structure.
Let’s take a look at the chart and study the lesson from the “Divergence Plus Trendline Break” Reversal Trade:

Be sure to read my prior commentary on the first trade set-up: The Short-Sale into $1,800 (on dual divergences and a “Three Push” Pattern).
The main idea was that price rallied into the key overhead “Round Number” of $1,800 per ounce on lengthy (multi-swing) negative momentum divergences.
Very aggressive traders like to short-sell INTO higher timeframe resistance, particularly if some sort of divergence (momentum, volume, etc) is present – it’s a low-risk trade in the context of a potential short-term reversal (or at least retracement) against the resistance.
Conservative traders prefer to watch the set-up develop and THEN take a position AFTER price triggers/signals entry on a corresponding price trendline or EMA (moving average) break/cross.
When you’re playing this type of set-up on the short timeframes (intraday like the 5-min chart above), the common question becomes:
“I see where I put on the trade, but where do I exit?”
Let’s keep it simple and discuss the answer:
“When price – in real-time – gives you a similar reversal signal.”
Of course, an alternate method would be playing for a specific price or percentage-gain target (such as $1,750 or $1,700) but let’s take it a step beyond super-simplicity (price level targeting).
If you’re playing a short-term reversal signal, try holding the position until price gives you a similar counter-reversal signal in real-time.
Admittedly, this isn’t as comfortable as trading for a specific target in mind, but it can help you generate a higher potential profit if the price swing has more power in it that takes it beyond a simple price level target.
In this case, let’s assume that we entered short at the red highlighted region which played off the negative dual divergences and inflection down from $1,800 that triggered an entry on the break of the $1,780 region which soon-after resulted in a 20/50 EMA bearish cross-over (August 10th).
We would place our stop-loss above the chart swing high at $1,800 and then play for an indefinite target until price gave us a reversal signal.
Price reversed its trend with a series of sequential lower lows and lower highs (price structure) which eventually resulted in a clear positive multi-swing divergence into the spike to $1,730 on August 12th (Friday).
Divergences are NOT flip-reverse position signals by themselves, but they can be position-exit signals for conservative traders (exit a profitable position into a clear positive momentum divergence with price).
Alternately, a trader can see the divergence but then demand that price break a falling trendline or EMA, which would serve as a trend reversal entry position – similar to the signal generated at the $1,780 short-sale trigger.
The price confirmation – breakthrough signal – occurred at $1,740 which triggered a reversal entry signal and of course exit signal for any remaining short-sale position.
The process starts over again with a reversal BUY signal at $1,740 with a stop-loss now under the $1,730 swing low.
To Summarize:
Let Exit Logic Equal Entry Logic.
If you’re entering a short-term reversal trade with divergences, hold the position until price generates a similar reversal signal in the opposite direction.
Also, it’s worth reviewing the trigger tactics for the Divergence + Price Break Trade:
- Observe a Multi-Swing Divergence
- Trade when Price BREAKS through (confirms) a trendline or key EMA (20 or 50 period)
- Observe the confirmation with a 20/50 EMA Crossover
Remember that this is one among many trading strategies, but it’s worth studying if you’re not familiar with the concept.
Though I’m using gold as a teaching example, this principle tends to work just as well in stocks, ETFs or other futures markets.
Corey Rosenbloom, CMT
Afraid to Trade.com
Follow Corey on Twitter: http://twitter.com/afraidtotrade
Corey’s new book The Complete Trading Course (Wiley Finance) is now available!

A lot of traders are expecting for gold to top out here soon. Judging by the divergence you have on the charts it looks like it's more likely to head lower…even on the daily chart it looks too much like a “rocket ship”
Mr. Rosenbloom,
Thank you for sharing this info. I am learning a huge amount from you. I have been trading actively for several years using some poor set ups that I came up with and surprisingly I haven't lost too much money. I am learning awesome set ups now and most importantly for me, patience in waiting for the right set ups. I love trading I want to do it for a living; while I am at my regular job I find myself looking at charts trying to find set ups. It's obvious to me that I would way rather be a trader than my current job. However, I was a danger to myself before I read your book and really started to learn how to trade like a pro. I am even for this year, I was up 30% last year, even for '08, and I actually managed to lose 40% in '09. This was all just trading by moving averages mostly depending on the angle of the 8 period moving average which isnt something you talk about and it caused me alot of fake outs and losses. You have taught me to look at price levels and divergences and it really does work. For instance I got long tlt before the market broke down hard as I watched momentum build and then price take out resistance. God Bless,
Augustine
Phoenix az