LULU Reveals a Valuable Lesson on Enormous Distribution Top Patterns
Traders are often drawn to reversal patterns, and Lululemon (LULU) gives us a textbook lesson in how to recognize and then trade reversal patterns as they develop.
Let’s take a look at this large Distribution Top pattern and learn the lessons we can apply to similar situations in the future.

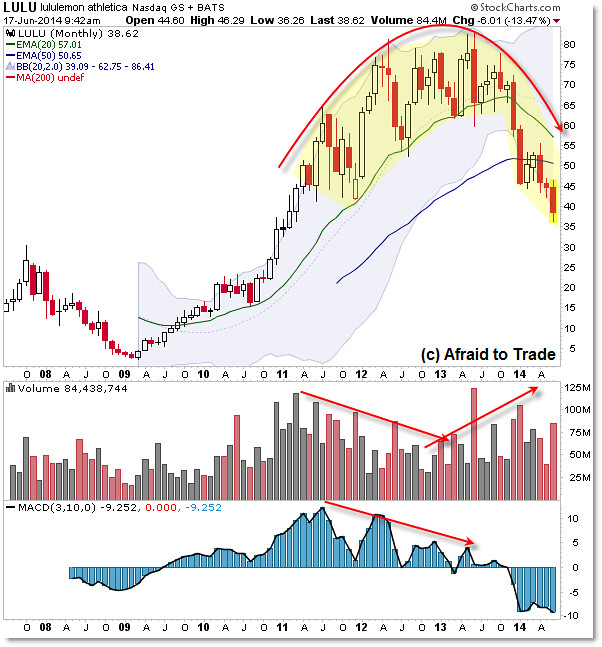
Large scale price moves (the “Life Cycle”) of a stock tend to progress through the phases of accumulation (the bottom or base), realization (the stable rally – like that of 2011 to 2013 above) and finally Distribution which often takes the form of a lengthy sideways move or rounded reversal like we see in LULU.
If we focus our attention on the Distribution Phase, we’ll often see a mature trend develop volume divergences with price as the moment – pace of movement – slows down (and negative momentum indicator divergences appear).
We can see this situation develop clearer on the Weekly Chart (intermediate term trend):

Note that volume was strong (rising) with price through 2011 but started to decline with the three price peaks of 2012 and 2013 (resulting in the final peak of June 2013).
Look for lengthy negative volume divergences with price to indicate a likely distribution phase for price.
Ultimately, price can continue trending higher despite negative divergences, and we need official signals from price itself for any sort of reversal or trading strategies to trigger.
We want to be very risk-averse when trading long/bullishly into a stock that is showing a mature trend with divergences.
We can begin to shift to aggressive bearish or short-sale strategies when price breaks rising weekly moving averages or hand-drawn lengthy trendlines that connect price lows.
The official “the trend is reversing now” signal or “Sweet Spot” in price occurred in December 2013 with the initial breakdown under the $60 per share level that then led to the “the trend is truly reversing” confirmation with the January 2014 gap-down.
From that point on – where I highlighted the volume portion red – volume surged higher with price during the sell-off or sharp decline phase for shares.
The right side of a Distribution Pattern should include clearly higher volume along with price falling in a new downtrend.
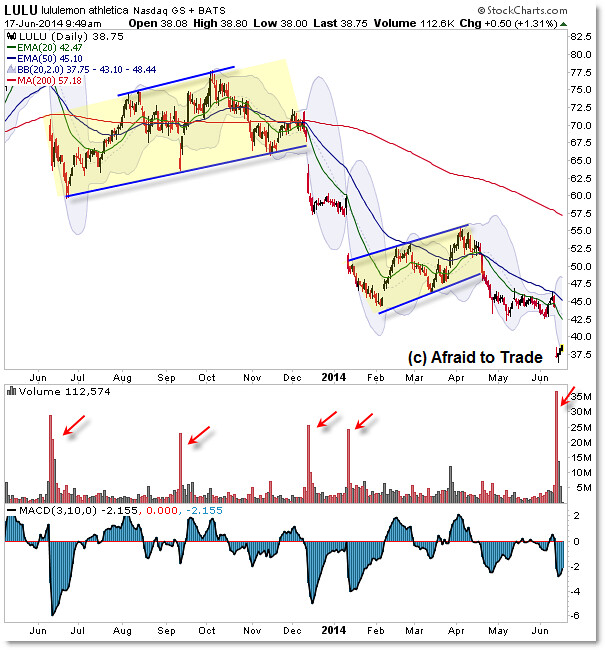
We can pinpoint trade entries – usually retracements – during the Distribution Phase on the Daily Chart:

A trend reverses when price develops a lower low, lower high, then takes out (breaks under) the new lower low.
Moving Averages will also cross bearishly and begin trending lower as price trades under them.
We can use moving averages and ‘flag’ trendlines like those drawn above to trigger short-sale entries into a downtrend in motion.
Always compare volume with price to determine the selling pressure – new price lows accompanied with high volume pressure and new lows in the momentum oscillator tend to precede future new price lows as the downtrend continues.
The goal becomes short-selling the pullbacks or bear flag price patterns along the way.
Continue studying the chart and lessons from LULU as the stock continues trading through the distribution phase.
Follow along with members of the Daily Commentary and Idealized Trades summaries for real-time updates and additional trade planning.
Corey Rosenbloom, CMT
Afraid to Trade.com
Follow Corey on Twitter: http://twitter.com/afraidtotrade
Corey’s book The Complete Trading Course (Wiley Finance) is now available along with the newly released Profiting from the Life Cycle of a Stock Trend presentation (also from Wiley).

