Ouch! XLF Financials Break Support to Trigger Breakdown
Stocks in the Financial Sector are triggering potential bearish sell signals today on a breakdown under a key support trendline.
Let’s highlight this trendline breakout, note the bigger picture, and plan accordingly.

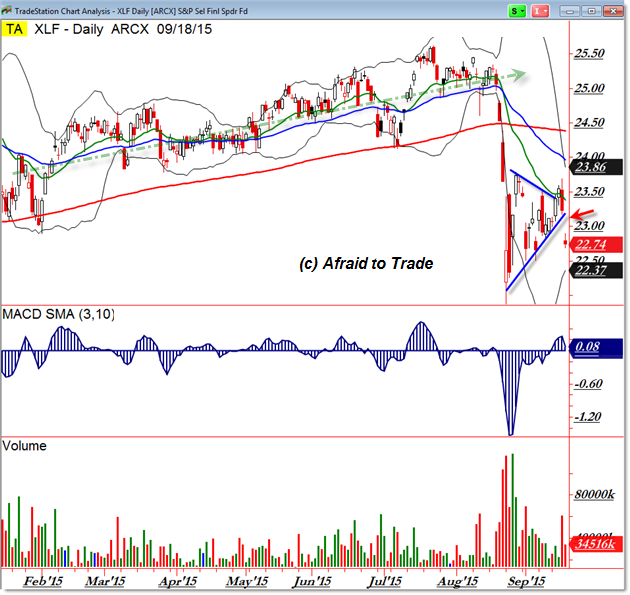
All was well through most of 2015 with the XLF Financial Sector SPDR (ETF) as seen with higher bullish volume in June and July along with a stable rising trend through all of 2015.
All of that changed in August when price collapsed and bearish (liquidation) volume surged to new highs… as price erased all the gains of 2015 and more in just three sessions.
A logical retracement catapulted price into the underside of the falling 20 day EMA (Green) which is a target to play for on a retracement swing.
It’s also a spot to short-sell against if you believe additional downside price action is likely.
After a failed breakout beyond this level – it’s roughly $23.40 per share – price formed a nasty Bearish Engulfing Candle on the Daily Chart and then broke under the lower rising trendline to trigger (and confirm) a sell signal in the ETF.
Shares of leading companies like Goldman Sachs (GS), and Morgan Stanley (MS) are showing similar patterns.
The implication from the breakdown is that price can once again move to test the spike-reversal lows near $22.00 per share in the ETF and comparable price levels in the individual financial companies that comprise the sector ETF.
Here’s a zoomed-in perspective of the pattern and breakdown today:

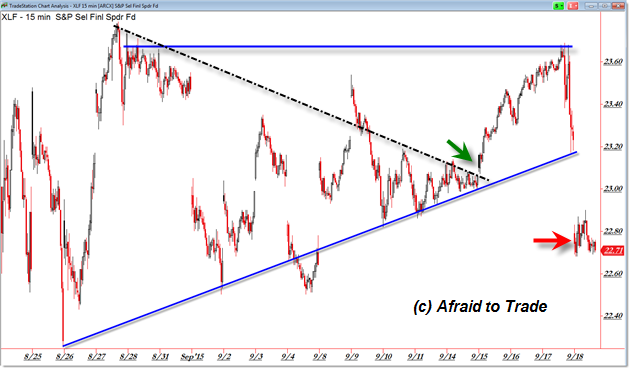
A Symmetrical Triangle formed for most of September and we saw the bullish breakout propel price into the upside target (prior high) above $23.60.
With divergences – and the Fed Day announcement yesterday – price moved down away from this target back toward the lower rising key support pivot ($23.20 at the time).
Today’s session sees broader market weakness and a gap breakdown lower for the Financial ETF (XLF).
This doesn’t bode well for the sector and again could suggest a continuation movement toward the prior lows above $22.00 per share.
For now, focus on the $23.00 level as an “Alternate Thesis Breakout” that – if price pushes back above it – could negate the expectation for a retest of the prior low.
Otherwise, we’ll focus on the possible movement lower “down away from” this short-term pattern.
Follow along with members of the Afraid to Trade Premium Membership for real-time updates and additional trade planning.
Corey Rosenbloom, CMT
Afraid to Trade.com
Follow Corey on Twitter: http://twitter.com/afraidtotrade
Corey’s book The Complete Trading Course (Wiley Finance) is now available along with the newly released Profiting from the Life Cycle of a Stock Trend presentation (also from Wiley).


We need to be careful following such trends, as it can change anytime and if we make even the slightest mistake then we could end up losing big time. I am extremely fortunate in having high quality broker like OctaFX because they have powerful rebate program to help me earn at least 15 dollars out of each trade that’s up to 1 lot size and it does not matter if I lose it or win since it’s present for both of the ways and that’s why I like it.