Quick Update on the SPX Gann and Andrews Pitchfork
Here is the most recent update of the Gann Prices and Andrews Pitchfork Tool post series on the S&P 500. You’ll probably find something interesting about yesterday’s bounce price.
(Click for full-size image)
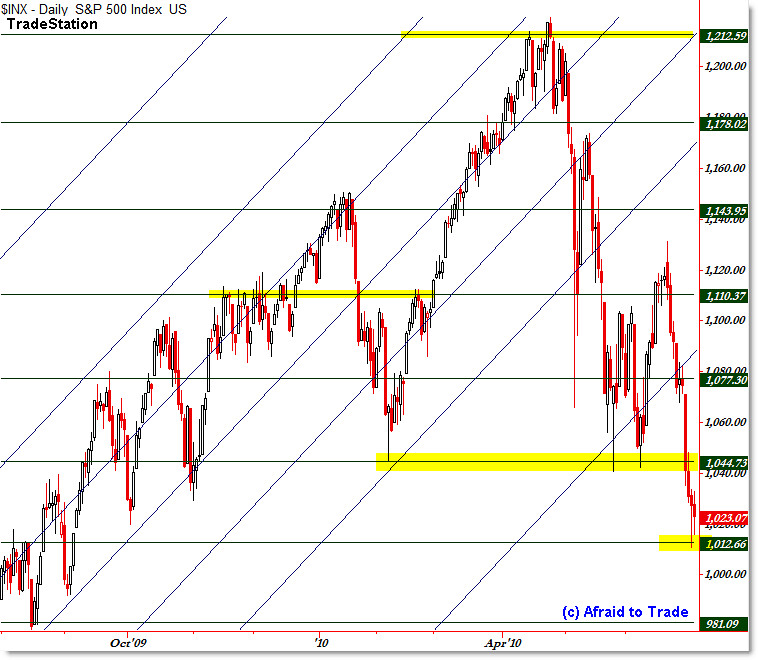
The horizontal green trendlines are Gann Squares prices originating off the March 6 2009 low.
Price peaked in April just above the 1,212 Gann number and supported off the 1,044 Gann number which held major support – that was one reason the break under 1,040 was so important.
In general, traders who use these Gann numbers watch for price to move from one Gann level to the next, and then try to identify if there are any other types of support, perhaps from moving averages or Fibonacci prices to locate ‘hidden’ confluences that other traders do not see.
It’s not magic, just one more variable to consider for potential price confluences.
And lo and behold, there was a major price confluence with two Fibonacci Levels – as I highlighted yesterday – at the 1,010 level which was Thursday’s low.
This adds one more bit of weight to the scale for the importance of 1,010.
And another quick note – price broke and closed under the lower Andres Pitchfork trendline – also originating from the March low.
The Andrews Pitchfork lines on the chart are rising blue ‘auto’ trendlines.
For Andrews Pitchfork traders, this was a major sell signal and potential turn (down) in trend. That’s another way to define trend, and for now, the signal is ‘reversal in trend.’
We’ll keep watching.
Corey Rosenbloom, CMT
Afraid to Trade.com
Follow Corey on Twitter: http://twitter.com/afraidtotrade


The 1217 peak the S&P in your article was as far as currency traders were willing to let the S&P run, as it exceeded the 1212 Gann Square you highlight in your article.
The peak of 1,217 occurred on April 23; and then the S&P rested at 1212 on April 26; at which time the currency traders massively sold the world currencies against the US Dollar which resulted in an unwinding of yen carry trades globally.
The S&P sell-off was preceded by a sell-off of the European shares, FEZ, and particularly the Spain shares, EWP, in early April as the European Sovereign debt crisis developed, and as the Asian shares, DNH, sold off with commodities, DBB, on credit tightening in China. The chart of VTI, VT, DNH, EWZ, FEZ and EWP shows the effect of all this debt deflation affecting the stock markets. Debt deflation is adverse to investing long any market.
The S&P was affected significantly by a spectacular rise in the Yen, FXY, which currency traders took from 105.44 on April 26, 2010 to 112.86 on July 2, 2010. The action in the chart of the yen is simply breathtaking.
One has to ask, can or would the currency traders take the Yen higher? If the yen falls, does it necessarily follow that the S&P will rise? These are answers that I do have an answer to. I am completely invested in gold coins, it was a buy and hold decision.
The other thing that is interesting about your chart is the “broadening tops” and “triangles” along the way down:
1) 1143
2) 1110 – A Gann Number
3) 1077 – Half way between Gann Numbers and the base of a head and shoulders pattern
4) 1044 – A Gann Number and major support
The S&P became a failed investment vehicle at 1110 and 1077.
Hi Corey – COuld you please comment on Sugar in terms of elliot wave. PLease I am waiting fro your analysis on Sugar.
HI Bhupesh :
I do not have the Elliot wave analysis but I have mastered a lil bit in Point and Figure theory and here is my analysis. For some unknown reasons I am unable to share the P & F chart with you . So here's my highlights of the analysis :
(1) Sugar continuous contract has a Bullish Price Objective of 21
(2) Has the Relative Strength wrt to the general market on a BUY Signal
(3) Price hovering in the middle of the P & F trading band . Hence very much manageable risk / reward with my stop loss being close below 15 .70 .
(4) If I tend to be a little conservative then I'd wait may be a month or so until the EMA 's of 20 day 30 day 50 day form a bullish alignment of 20 day above 30 day above 50 day .
hey corey
you have that char scaled to perfection?