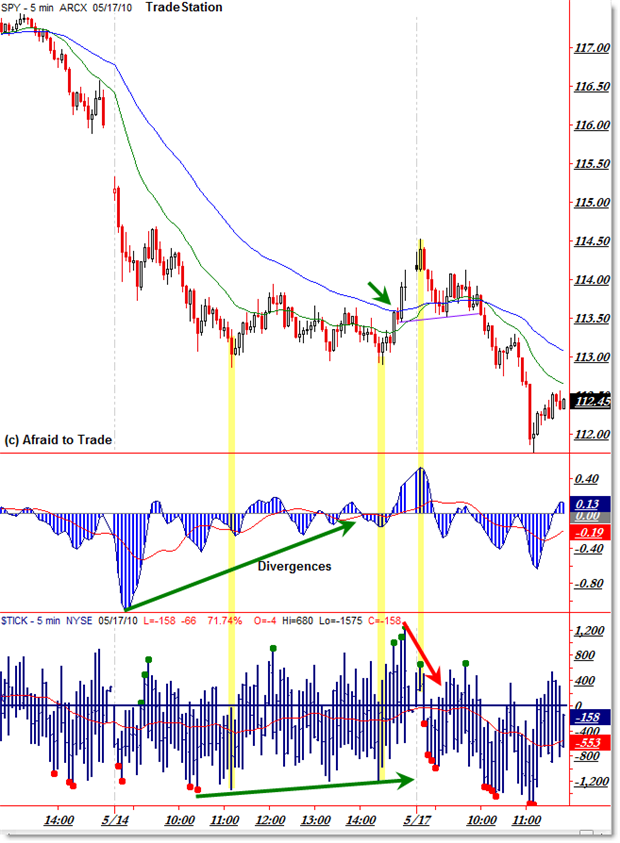
SPY Divergences and Downtrend May 17
Friday’s action concluded with multi-swing positive momentum and internal (TICK) divergences, which forecast the likelihood of a retracement that was expected early in the week… but it looks like we’ve already had the expected – smaller than usual – and now the prevailing downtrend continues.
Let’s take a look:

We’re seeing the 5-min SPY (S&P 500 ETF) as a benchmark, with the 3/10 Oscillator under price and the NYSE TICK in the lower panel.
As I frequently love to highlight, divergences (in momentum and internals) often precede future retracements/reversals, so it’s a good time to take profits and begin planning a potential position in the event that the market does retrace as expected.
The trigger point after a lengthy divergence is often the price breakout above either a trendline or the 50 period EMA as shown above – that was at $113.50 and triggered just before Friday’s close.
We did get a continued retracement as expected… but the ETF rose 50 cents to peak this morning at $114.50 before heading back down in a continuation of what appears to be a very powerful higher timeframe downward bias.
Look closely and you’ll see a mini-negative TICK divergence as we rallied to new intraday highs, when comparing the TICK to Friday. It’s not always ideal to reference the morning TICK to yesterday afternoon’s TICK, but it can be done nonetheless.
Price closed Friday at the $114.00 level with a TICK extreme of 1,257 and then – as expected – rallied to a new swing high of $114.50 but this time on a TICK extreme of 659. That is called a “non-confirmation,” and hints that the odds of further upside action are limited, unless we start to see a ‘pick-up’ in TICK highs.
We didn’t, and price then broke back under the reference levels of the 20 and 50 EMAs along with a mini-trendline that I’ve drawn at $113.50… and then we were back to the prevailing downtrend.
I thought this gives a good example of this concept, how momentum divergences ‘battle’ trends, and how – when you’re putting on a trade – you’re either betting that the trend will reverse, or that it will continue.
I’ll talk more about this and describe the higher timeframe levels to watch in tonight’s Idealized Trades Report for members.
Corey Rosenbloom, CMT
Afraid to Trade.com
Follow Corey on Twitter: http://twitter.com/afraidtotrade

Can we now target 110, and are we now in a 4th wave retracement before another 5 wave down?
It looks like we're getting a bounce off the $112.00, so we'll need to monitor that development.
$110.00 seems to be the consensus/confluence target though.
In this market, especially options expiration week, how wide would you put your stops?
Corey how about the reversal at 12:30-1:00 off the S&P lows and now back above 1125 on the S&P 5 minute charts. Positive divergence on MACD 5 min chart started at 1:00
Unfortunately, this was written this morning before bargain hunters stepped in this afternoon to reverse a huge loss into very small gain. So a flat day overall.
True! I can't update multiple times during the day – usually just once or twice.
It appears the bulls are still trying to be relentless in the face of deteriorating charts!
Good Call Doug.
Right – we always monitor for signs of divergences or breaking of trendlines, both of which occurred shortly after I put up the morning post.
Led to an unexpected afternoon reversal and some “Popped Stops” (of the bears) along the way.
The s&p 500 seems to be under considerable pressure…I'm wondering what your elliott wave count is from either the 2007 highs or the march09 lows. thanks, gt