SPY Trendline Angular Momentum and Bull Bear Psychology
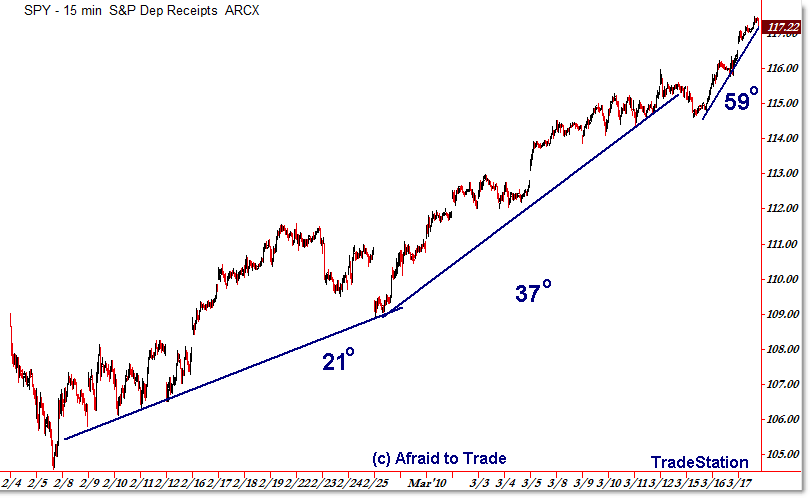
While the title might not sound that interesting, it can be important to watch “Angular Momentum,” or in simple terms – the change in the angles of rising trendlines – of the current SPY and S&P 500 intraday charts, which highlights an important point about the recent rallies.
Let’s take a look at the recent “Angular Momentum” chart and see what I mean:
The way to create one of these charts is to draw rising trendlines to connect as many price swing lows as reasonably possible, and be sure to draw additional trendlines as needed.
Usually, you’ll come up with three or four separate trendlines you can draw on your chart… and this works for all timeframes.
Keep in mind that – depending on how you scale your chart – your angles will be different, but it’s most important to pay attention to the rate of ascent or steepening of the angles instead of the absolute angles themselves.
What I’m showing here is the three dominant rising trendlines that show the recent shift in character or behavior of the market… to one of urgency to rise and despair on the part of short-sellers/bears.
Often, these type of cycles often progress in the following order for the Bulls:
Phase 1: Doubt, as in “This is a bear market rally and then price will fall.”
Phase 2: Realization, as in “Ok – so the market is going higher, but the moment I get long is when it will reverse.”
Phase 3: Euphoria as in “Oh my gosh I’ve been so stupid to miss this rally that I have to buy NOW! NOW! NOW!”
And, as you might suspect, the cycle takes a different turn for the Bears:
Phase 1: Doubt, as in “Here we go! This is a rally to short to plunge the market to new lows!”
Phase 2: Confusion/Realization, as in “Ok, so I know they’re driving it higher, but I’ll keep trailing my stop higher because the market will turn at ANY point now and the moment I exit my short is the moment it will fall, so I’ll hold on.”
Phase 3: Capitulation, as in “*$^%@! They did it to me again! AHH, I have no choice but to take a much larger stop than I thought – gosh there I go again losing money.”
This type of logic has been explained in many different forms, but it still surprises me at how many times it plays out in text-book fashion.
That’s why the first ‘phase’ often has a smaller, more reasonable angle which gives way to a steeper angle which then finally morphs into an absolutely unsustainable angle as price climaxes while bulls pile in and bears capitulate.
No one knows where the absolute top will be, but when you start to see angular momentum increase like this, it’s a safe bet that we’re in the third phase and to monitor your emotions very closely and follow price and be aware of any sudden shift and not get caught in a downdraft.
Take some time to study this principle in more detail – it could save (or make) you a lot of money.
Corey Rosenbloom, CMT
Afraid to Trade.com
Follow Corey on Twitter: http://twitter.com/afraidtotrade


Very cool chart!
May I note that measuring slopes in degrees on a chart that has in different units is fundamentally incorrect. (Stretch your chart in one of the dimensions, and you'll see).
Similar (though less obvious) misconception is drawing circles on stock charts, a circle implies constant distance from the center – and there is no such thing as distance when your x is in hours and y in dollars and cents.
True – I'm very aware of the need to square-out charts when applying arc or circle work (I may have mentioned that in a previous post) and I do so by using gridlines and then aligning the squares to a 45 degree angle.
Most people will not take the time to do that, which I why I mentioned the importance is on the degree of angular change rather than the angles themselves.
Good call though! Thank you for sharing.
angle, flavor n feel each right for climactic gappiness to ensue. good look, Corey.
I can't remember how I found your site, but I am glad I did. I feel that as a newbie, you can teach me a ton. Thanks!
RRott
Like all the angles….let's see how this market plays out.
Nice chart! Informative
Yes, I agree. We have applied this method last year, don't you remember guys? We catch the exact bottom using the above strategy. We have not listened to the voice of the Lord Elliott.
Yes, I agree. We have applied this method last year, don't you remember guys? We catch the exact bottom using the above strategy. We have not listened to the voice of the Lord Elliott.
The chart tells it all, thanks for sharing. Lets hope and see how things turns out in the end.