The December Symmetrical Triangle Pattern in Gold
Not to be outdone by the recent S&P 500 triangle pattern, Gold is forming a broader Symmetrical Triangle Consolidation Pattern that we’re following closely for any sign of a breakout from the converging trendlines.
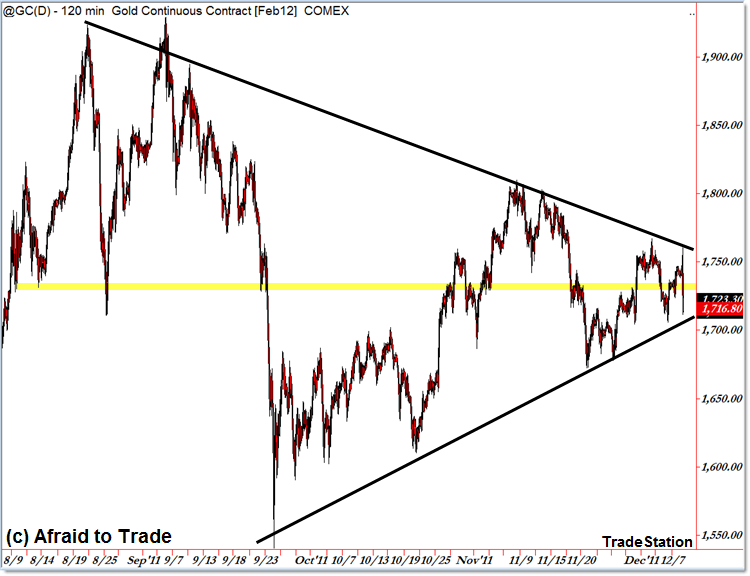
Let’s look at this situation from two perspectives, starting with the “pure price” intraday level:

When discussing a Symmetrical Triangle, it’s best to start with three definitions in the structure:
The Declining Upper Trendline, the Rising Lower Trendline, and the Midpoint or Central Value Area.
While the Trendlines should be self-explanatory, the Midpoint/Central Value Area is the center of the consolidation – or the price at which the Trendlines will eventually meet (also called the “Apex”).
I highlighted the current Midpoint at the $1,730 level.
Historically, symmetrical triangles have tended to break out 66% to 75% of the way from the start of the triangle to the apex (convergence point) which places us roughly in that area currently in gold.
This was the case with the smaller Triangle pattern in the S&P 500 I highlighted as it was developing (we had the successful breakout and resolution to the downside target).
No, that’s not to say Gold will follow-suit perfectly, but it is the dominant price pattern at work.
Triangles are Consolidation Patterns that often forecast a future breakout or range expansion/trending move (though you can’t absolutely predict in which direction price will expand… only that it will likely expand in an impulsive breakaway move).
That’s why we’ll be watching these trendlines carefully this week and into next – the current boundaries are roughly $1,750 on the upside and $1,710 on the downside – both converging towards the $1,730 apex.
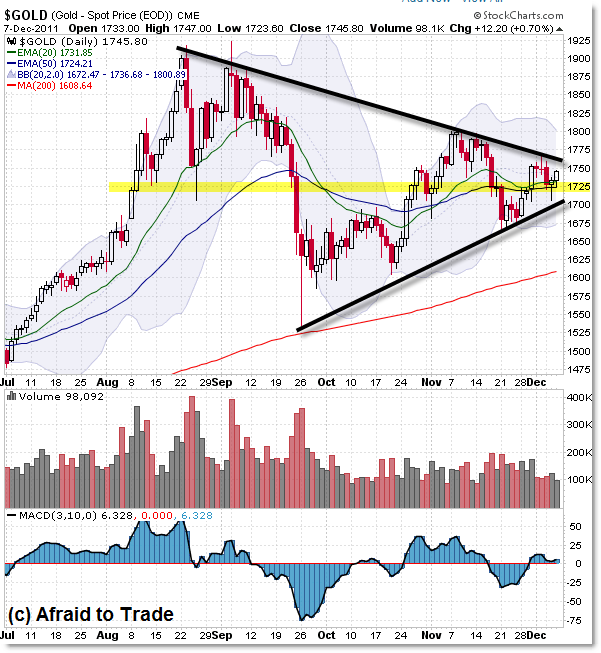
Let’s step up the perspective and add a few indicators on the Daily Chart:

In a range compression (consolidation) pattern, moving averages tend to lose their effectiveness (when compared to serving as support/resistance for trade entry during trending phases), and it just so happens that the averages themselves converge towards the Midpoint at $1,730.
You can see the broader pattern stretches back to the September highs to lows which builds an estimated height of $350 ($1,900 minus $1,550).
Using classical price pattern projections, this suggests a breakout above $1,750 could lead to a continuation move that targets $2,100… while a downside breakout under $1,700 eventually targets $1,350.
Given the long-term (primary) trend, one would suspect the resolution (breakout) would be to the upside for a primary trend continuation, but as traders, we must be quick to adapt when things don’t work out exactly as expected.
If there happens to be a downside break, we’ll all be watching the $1,600 confluence for any sign of support.
However, an upside break would immediately target $1,800 and any firm movement above $1,800 enters the “Open Air” territory between $1,800 and $1,900 (one could see a ‘slice-through’ effect impulse in the “open air” territory).
Stay unbiased and keep watching these levels for any sign of breakout and of course continuation (instead of a frustrating trap) with respect to these price levels.
Corey Rosenbloom, CMT
Afraid to Trade.com
Follow Corey on Twitter: http://twitter.com/afraidtotrade
Corey’s new book The Complete Trading Course (Wiley Finance) is now available!

Bought some 160 puts (1.2) on Monday aiming for the downside here, and just sold out this morning (5)! A nice return, although I sold out a little too quickly tho. Puts reached almost 8 at their peak today
Great point about staying neutral until the breakout Corey. Seems we got the big move lower today in GLD and SLV so wouldn't you expect a move higher to re-test the breakout as new resistance going forward?