The Tesla TSLA Daily Chart Drop to Support July 6
Tesla (TSLA) shares plunged this week, collapsing from the $380+ peak toward the $300 level.
How did it happen and what’s the play from the currently achieved support target?
Let’s discover together:
First, take a look at yesterday’s lesson on trend reversals in Foot Locker (FL).
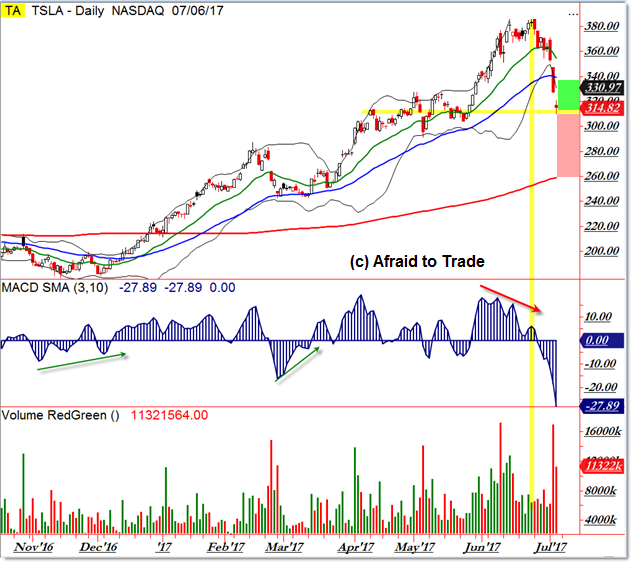
With that information, we see a similar push up to new highs, a “double top” or “failure swing” testing the prior high above $380 along with caution/warning signals from momentum.
Volume similarly declined (diverged) on the second peak, locking in a non-confirmation of the new high.
From there, sellers became aggressive, collapsing the price lower beneath the 20 day EMA and then rapidly under the 50 day EMA.
The 20 and 50 day EMAs serve as targets and possible retracement buy points during uptrends.
Tesla shares plunged beneath these levels, not stopping once.
The breakdown took us toward the midpoint of the prior consolidation (highlighted) near $315 per share.
IF buyers fail to step in here and support the price, then we’ll likely see a full fall toward the next target of the rising 200 day SMA.
For this week and beyond, use the $315 bull/bear pivot as your “departure point” for your trades.

Follow along with members of the Afraid to Trade Premium Membership for real-time updates and additional trade planning.
Corey Rosenbloom, CMT
Follow Corey on Twitter: http://twitter.com/afraidtotrade
Corey’s book The Complete Trading Course (Wiley Finance) is now available along with the newly released Profiting from the Life Cycle of a Stock Trend presentation (also from Wiley).”