Triple Index Busted Support to Start the May 23 Week
The three major US Equity Indexes have been precariously straddling initial support levels, and as we start this May 23rd week, all three indexes gapped down under these initial levels.
Let’s take a “Triple Index” overview of the current structures with regard to the “Barrier” levels to watch and then future “Points of No Return.”
First, the Dow Jones Index:

A quick glimpse shows us the critical barrier level #1 at 12,400 is failing – so far – to contain the sellers this morning. Buyers want to see price back above 12,400 soon, else we could see a waterfall event that takes price back to the 12,100 April low (Barrier #2).
The 50d EMA rests at 12,425 and the 20 Week EMA (not shown) rests at 12,211 – these are simple reference levels to watch.
Further deterioration here returns us to the confluence at 12,100… and any move under the “psychological” barrier at 12,000 opens the door to revisit 11,600.
Of course, these bearish targets are rejected with a price movement back above the declining trendline and 20d EMA convergence at 12,600.
On to the NASDAQ:

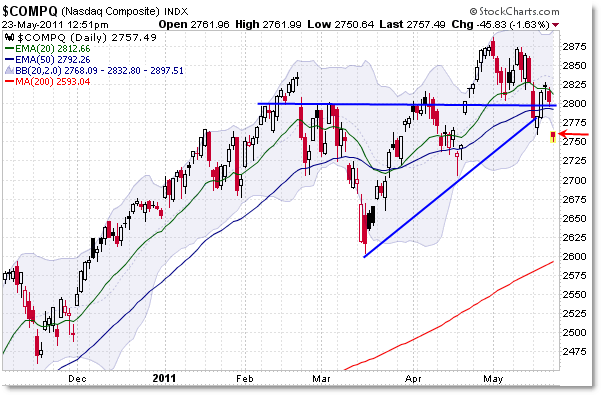
The NASDAQ opened with a large gap-down – crushing under the 50d EMA, 2,800 “Round Number” reference level, and the rising trendline that connected the 2011 swing lows as drawn. That’s not good for buyers.
Further downside action under 2,750 – today’s low – opens the door to expect 2,700 then a retest of 2,600’s key confluence should sellers push the index under the 2,700 Barrier #2 pivot.
Of course, these bearish/downside targets are negated if we see another “trap” which results in a close/breakout above 2,852.
Let’s spend a little more time on the S&P 500 (Daily):

I focus most of my attention on the S&P 500, and we’ve seen a progression of bearish evidence developing – starting with the declining trendline, series of lower lows, and breakdowns under the 20 and now 50 day EMA at 1,330.
The S&P 500 broke an important barrier level this morning, and now sets it up on a collision course with 1,300 which is only 10 points away from the morning session low.
Buyers need to see this index back above the 1,340 confluence pivot – but if that doesn’t happen soon, expect 1,300 to be challenged which is a barrier level that – if broken – opens the doors for a retest of the 2011 low at 1,250 (now forming a convergence with the rising 200d SMA).
Finally, the bigger picture on the S&P 500 (Weekly):

Another reason to “Watch 1,300 Like a Hawk” includes the rising 20 Week EMA at 1,308 (1,300 for easy reference).
A breakdown under 1,300 – as mentioned above – opens the door for a play to the 1,250 “Edge of the Cliff” confluence level which includes the 50 Week EMA at 1,244 (1,250 for easy reference).
You can see volume and momentum diverging with price – that’s no good.
Take a moment to refresh the prior two posts I’ve shared on the Sector Rotation Model which is similarly calling for caution in this market:
“Clear Bearish Signals Developing from the Sector Rotation Model,”
“Charting the Big Breakouts in Defensive ETFs XLP XLV XLU”
At the moment, the odds appear to be tipping to the bearish side, but we need official price breakdowns to confirm the bearish warnings.
Price ultimately is key, and it’s not paid off to fight the bullish trend in place, which has been heavily influenced higher by QE2 (which ends officially next month).
Think of these immediate levels as Barriers that are standing in the way of the “Cliff,” which would be the respective 2011 lows in each market.
If you visit the Grand Canyon or any major cliff, there will be one or two series of barriers that prevent you from peering over the edge – lest you fall off the cliff.
Of course, if you decide to jump over the barriers and peer over the edge anyway, you risk falling off the cliff entirely, which would of course take you beyond the “Point of No Return” (to say the least).
That’s a good analogy of how to visualize the lower levels in the Triple Index structure right now.
Today, we broke “Barrier #1” in the markets and are setting up plays to challenge lower “Barrier #2” (the April 2011 lows), and any breakdown of the final “Barrier #2” sets up a play for the “Edge of the Cliff” at the 2011 lows.
Watch all these levels closely – along with the upper Resistance Levels which – if broken – would suggest the market was taking a breather from this risky “Peering Over the Cliff” business we’re experiencing now.
Corey Rosenbloom, CMT
Afraid to Trade.com
Follow Corey on Twitter: http://twitter.com/afraidtotrade
Corey’s new book The Complete Trading Course (Wiley Finance) is now available!

I am looking to go long at 1305ish with a reasonable stop hoping PPT continues to boost this market
Agreed that 'barrier' levels are good places to put on a long (with tight stop), and that QE2 (along with investor/trader reactions)) continues to support this market/perpetuate the rally, but the magic buyers seem to be having trouble. It looks like buyers are trying to support it but aren't being very successful (as of now) so it will be interesting to watch the resolution at these levels here. Be safe.