A Triple Timeframe Update of SP500 Market Structure
A member asked a question regarding the short-term and intraday trends of the current SP500 and I wanted to take a moment to update the current “Market Structure” view of the trend and what reversed from the recent sell-off.
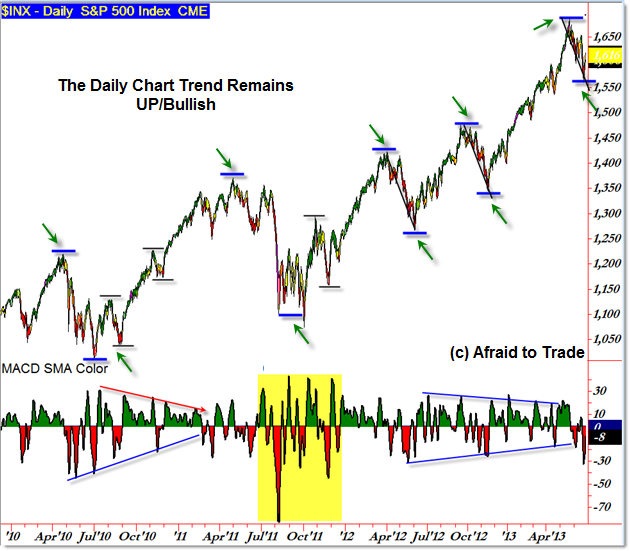
We’ll start with the Daily Chart then note two intraday timeframes to compare ongoing Structure:

Market Structure refers to the pure price progression of swing highs and swing lows that “develop” or build a Trend in Motion.
A trend is relative to the timeframe you are watching or trading, and a downtrend on a lower timeframe may simply be a counter-trend retracement on a higher timeframe.
I’ve discussed this topic in various posts including “Google Provides a Lesson on the Importance of Viewing Multiple Timeframes” and “An Update on IBM Reveals why using Multiple Timeframes is Critical.”
The Daily Chart reversed to an uptrend after the March 2009 low and has not officially completed a Trend Reversal process since the low (the same is true for the Monthly and Weekly Chart).
Thus, as we view the current intraday charts, we do so within the context of a 5-year Bull Market or Uptrend.
There have been deep retracements (mid-2010 and mid-2011 after QE2 ended) but the three most recent Daily Chart retracement phases have been shallow or contained within a 150 point swing.
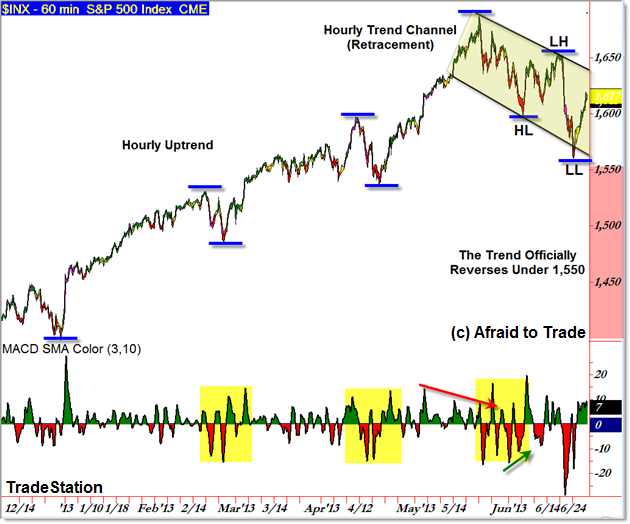
Let’s keep the uptrend structure in mind but now view the Hourly Intraday Chart:

The big question we’re trying to answer is whether this recent sell-swing or sell-phase has resulted in a Trend Reversal or not.
At the moment, the answer is no, there has not been a higher frame or daily chart trend reversal but the market is taking the “gray area” pathway and will officially reverse the ongoing trend on a breakdown and close under 1,550.
By definition, an Uptrend is comprised of a progression of Higher Swing Highs and Higher Swing Lows; a downtrend is just the opposite.
Reversing a trend in motion is (at least) a Three-Step process that can develop one of two main pathways:
- Price forms a Lower Low, swings up to form a Lower High, and then swings down to Take Out the Lower Low
- Price forms a Lower High, swings down to form a Lower Low, swings up to form a Lower High, and then finally swings down to take out the Lower Low
It’s easier to spot a trend reversal when the market pushes to a visual lower low first instead of starting with a lower high as has been the case with the recent sell-swing.
The first main (hourly) Lower High developed into the 1,655 area just ahead of the Federal Reserve policy announcement that sent investors selling and shifted the Intermarket Landscape.
While the Hourly Chart hovers in the “gray area” in terms of definitional trend structure, it still counts as an official retracement against a prevailing/higher frame uptrend.
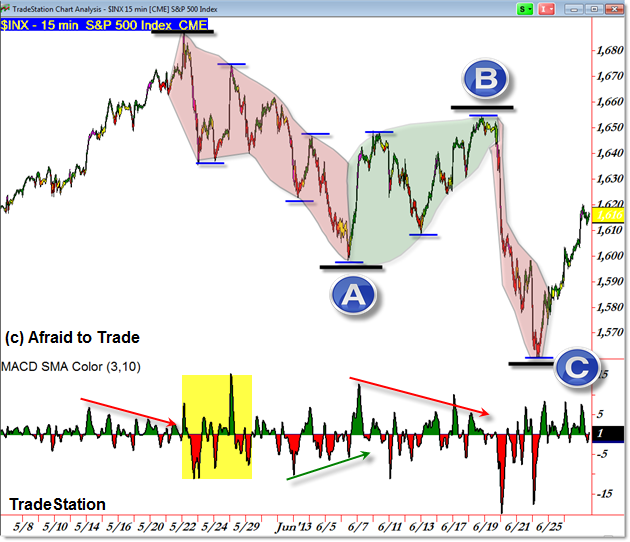
As I mentioned earlier, the lower you drop on the timeframe scale, the more detail you see and we do have an official trend reversal as seen on the 15-min chart:

I highlighted the Hourly Swing Structure as an “ABC” (A down; B up; C down) structural move so we can compare the internal swings that “built” the Hourly Structure (and Daily Chart retracement).
In simple terms, we see more detail from the 15-min chart and can pinpoint additional swings within the broader movement.
Thus the trend is reversed officially on the lower frame charts as is evidenced by the structure and progression of ongoing lower lows and lower highs.
The momentum oscillator is helpful for viewing positive or negative divergences ahead of a possible trend reversal in structure.
The most important level to watch will be the 1,555 support level – if broken, it would officially reverse the higher frame trends via the “Lower High, Lower Low, Lower High, Take out the Lower Low” structural pathway.
Until that happens, we’re in a ‘gray area’ where the higher frames officially suggest pro-trend continuity (and that the lower frames are simply ‘downtrending’ against a higher frame retracement) unless proven otherwise with an immediate swing lower from current levels.
Join fellow members to receive daily commentary and detailed analysis each evening by joining our membership services for daily or weekly commentary, education (free education section), and timely analysis.
Corey Rosenbloom, CMT
Afraid to Trade.com
Follow Corey on Twitter: http://twitter.com/afraidtotrade
Corey’s new book The Complete Trading Course (Wiley Finance) is now available along with the newly released Profiting from the Life Cycle of a Stock Trend presentation (also from Wiley).


Clarity! This analysis of the market from a trader's view is the best description of market action I've seen in a long time. I've tried to explain to non-traders, i.e. friends and family, precisely what I watch during a normal day but they always get wrapped up in the minutia. Great job on a very mundane but important subject.
love it