Exploring a Hidden Resistance Level in Amazon AMZN
On the surface, Amazon (AMZN) shares triggered a mini-Bull Trap on a break through daily resistance, only to collapse against a hidden wall.
Let’s take an advanced view of the longer-term chart then step inside the recent reversal to plan the next price swing and possible targets for shares.

The chart above shows two Andrews Pitchfork tools overlaid on the two larger retracement swings in 2012 and the end of 2011.
I don’t remember seeing a similar pattern where two different price retracements (swings) produced an almost identical Andrews Pitchfork grid like this.
Nevertheless, I color-coded each Pitchfork and highlighted the midpoint overlap in red.
I then copied and pasted a zoomed-in version of what’s going on right now into the “hidden” $380 per share level which is where two converging lines meet.
So far, price has traded down against this trendline overlap (confluence) level.
The most recent price low (reversal) developed off the lower trendline above $345 per share. That will be our focal point if indeed shares do continue to trade within these two “hidden” trendlines.
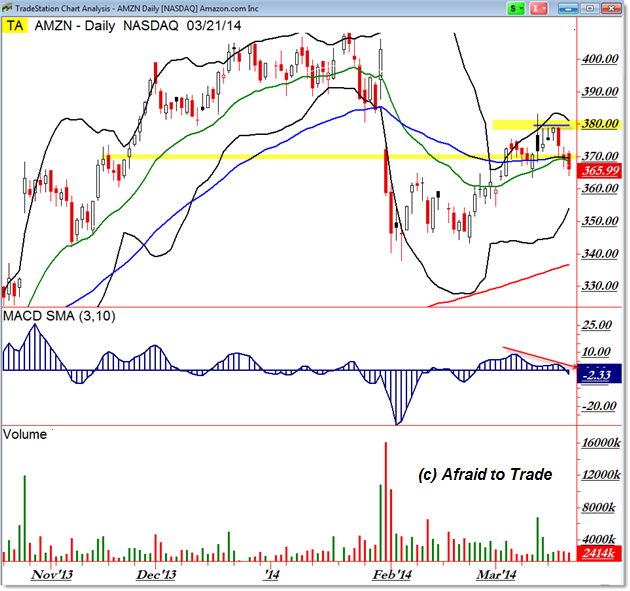
Here’s a classical Daily Chart for comparison:

After a lengthy negative divergence going into January 2014, shares collapsed lower to the $340 per share level (note the Andrews Pitchfork chart above).
From there, positive divergences occurred at a critical horizontal support level near $345 per share and price traded up toward the falling EMA targets ($370) and then broke above them for a potential breakout play.
The breakout trade failed this week with a return under the confluence (cross-over) of the 20 and 50 EMA which is occurring in today’s session.
The short-term implication from a ‘trap’ scenario is that if price can’t trade back above the 20/50 EMA overlap ($370 for easy reference), then it likely sets in motion a sell-swing of liqudation from the buyers/bulls who are trapped, as short sellers enter new bearish positions.
Again, the simple target would be a return to the $345 per share support… or a breakdown lower than that.
Finally, here’s another perspective of the intraday landscape and why the current support sets the stage:

Note the impulsive breakout on March 13th with higher volume and momentum. So far, that price was the short-term high and shares have met “unexpected” resistance into the $380 per share wall.
An Ascending Triangle consolidation pattern formed and shares recently triggered a breakdown impulse under $376 per share.
The target was the $365 area which was achieved today. It’s the $365 level that draws our focus for any short-term trading strategies in Amazon.
A breakdown under the highlighted support likely sets in motion a continuation sell-swing toward the $355 prior swing low then into the $345 higher timeframe parameters.
Otherwise, look for shares to trade around the $365 to $380 rectangle region or value area.
Incorporate these levels into your trading plans for Amazon (AMZN) shares.
Andrews Pitchfork Content (background):
S&P 500 Andrews Pitchfork and Gann Levels “Chart Art”
Andrews Pitchfork Update for the S&P 500
Gann and Andrews Pitchfork Update (S&P 500)
Andrews Pitchfork Trendline Channel Update on the Euro (EURUSD)
Follow along with members of the Daily Commentary and Idealized Trades summaries for real-time updates and additional trade planning.
Corey Rosenbloom, CMT
Afraid to Trade.com
Follow Corey on Twitter: http://twitter.com/afraidtotrade
Corey’s new book The Complete Trading Course (Wiley Finance) is now available along with the newly released Profiting from the Life Cycle of a Stock Trend presentation (also from Wiley).


What a good trade notification about levels. Thanks for it.