Quick Andrews Pitchfork Trendline Update on the SP500
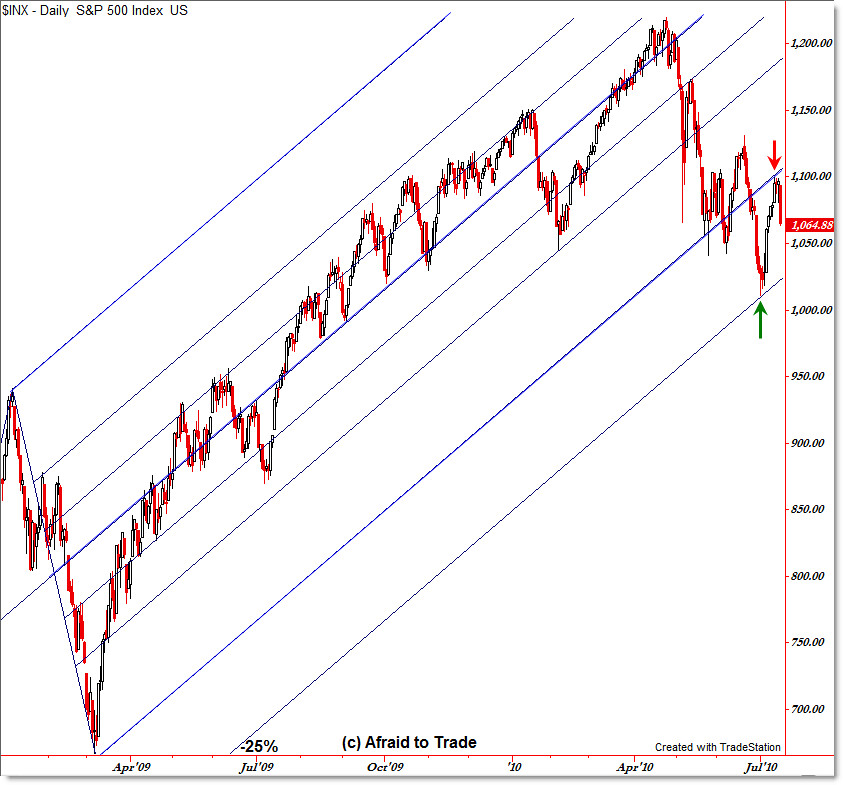
Let’s take a quick look at something very interesting in the daily Andrews Pitchfork auto-trendline tool in the S&P 500.
SPX Daily:
Click for full-size image.
This is the same Andrews Pitchfork trendline tool I’ve been showing in various updates on the blog and for members.
Main idea? Starting the grid with the November 2008 low, January 2009 high, and March 2009 low, the Andrews Pitchfork tool draws the three trendlines, but I have added additional values to show more ‘auto-trendlines’ for reference.
The goal is to see how the price follows the projected trendlines, and if price forms a confluence with other factors as it tests a trendline extreme – sometimes the trendlines act as angled support and resistance … which is just a fancy way to say “it’s a trendline.”
On the break under 1,040 last month, the S&P 500 also broke under the lower Andrews Pitchfork trendline, which is often seen as an early signal of a trend reversal… or official signal, depending on how much you value the Andrews Pitchfork tool.
Notice how price remained within the boundaries, bouncing around the trendlines, through 2009 and then recently broke the lower line.
I added a “-25%” line – the lower line (again, think “auto-angle trendline”)- and lo and behold price supported on this line with the lurch down to 1,010 in early July. Interesting.
Now, the price hit the underside of the dominant trendline at the 1,100 area and turned sharply lower on Friday. Again, interesting.
I’m not saying Andrews Pitchfork is magic – it’s not – but it is interesting and there are traders who use the Pitchfork tool extensively – much more than the basic way I’m showing above.
File it under interesting if anything, but let’s see if this bearish signal leads to further price decline back to 1,010 or to the lower rising line under 1,025.
Corey Rosenbloom, CMT
Afraid to Trade.com
Follow Corey on Twitter: http://twitter.com/afraidtotrade


Is the Dow really repeating the Great Depression pattern?
http://www.bespokeinvest.com/thinkbig/2010/7/19…