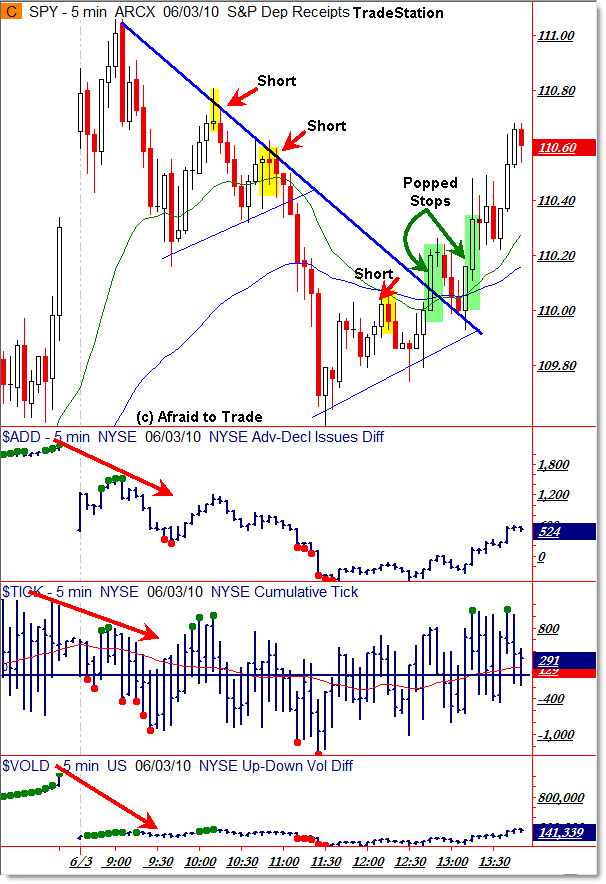
Intraday Reversal and Popped Stops Example June 3
For the second day in a row, we’ve had an afternoon reversal rally after prior divergences in internals – that’s unusual but it does happen and it can reveal the character of the market. It’s also a lesson in active trade management.
Let’s look at the Reversal and the “Popped Stops” Play that followed:

To get a feel for the psychology of the chart as this unfolded in real-time, take a look at my earlier comments on the divergence in market internals.
I’m often asked why I’m not more forceful in my analysis, and why I don’t come out swinging saying “The market is going to decline because of a divergence!”.
Today should be proof enough of that – ALL trades are based in probabilities, never certainties. Divergences highlight a non-confirmation, and indeed divergences are correlated with reversals… but they’re not 100% correlated.
You can have reversals without market internal divergences just as you can have market internal divergences without reversals.
Remember – divergences warn of non-confirmations in the price structure – and we got a pretty steep down move from when the non-confirmation occurred on this morning’s high – the SP500 fell 14 points after the morning divergence locked into place.
The market gave you three clean short-sell signals as drawn with arrows – simply stated, price formed reversal candles (dojis) at the upper trendline. In the case of the third trade, price rallied into the 20/50 EMA confluence – the “Cradle Trade.”
Price was headed lower but bulls stepped in to support the price, driving the market/index back above not only the 20/50 EMA confluence, but the established trendline as drawn.
And what happens when a clean/obvious intraday short-sale signal fails?
That’s right – those who were short are forced to BUY to cover their position, which actually helps drive the market higher.
I call this the “Popped Stops” trade, and it’s an intermediate/advanced technique that can lead to a quick, profitable trade as the market “slices through the stop-losses like butter,” creating a sudden Positive Feedback Loop.
A Positive Feedback loop is a phase where Bulls buy (whether they’re looking at charts or not – perhaps for fundamental analysis reasons), and Bears (chart traders who were short) are forced to Buy to cover… or in essence, bulls buy, bears buy, more bulls buy (breakout), which leads to more bears to cover… etc until the loop is broken.
The alternate interpretation is that you should NOT remain short when a positive feedback loop occurs.
I’ll be discussing this further in tonight’s Idealized Trades Report to Subscribers – I have plenty of examples of similar Positive Feedback Loops and Popped Stops Plays (particularly toward the end of 2009) in the member archives section.
Always watch price for signs of confirmation or non-confirmation – and realize that situations – and market character – change during the day. It’s not enough to figure out the morning session properly – the afternoon session may be – and sometimes is – completely different!
Prior Posts on Popped Stops:
March 25: “Pure Price Trendline Look at the S&P 500 Reveals Feedback Loop”
March 16: “Recent Popped Stops Again Reveal Character of the Market”
March 22: “Popped Stops Gap Play”
“Lessons From Failed Signals and Popped Stops”
“What Happens when Resistance is Broken?”
“Opportunities from Popped Stops Intraday”
Corey Rosenbloom, CMT
Afraid to Trade.com
Follow Corey on Twitter: http://twitter.com/afraidtotrade

I don't think you can fairly say the first peak is a short. A trendline can't be drawn at the time because the peak hasn't been formed. Also, TICK was higher than the previous high in price–a positive divergence. The other two shorts are well justified and have risk parameters defined.
Anyhow, I always appreciate hearing your insightful thoughts each day. Thank you!
while the trendline didn't exist at the time, isn't it a classic reversal candle (shooting star i believe its called)?
Agreed – I mentioned that in tonight's report that a trendline could not be drawn on the first short, but that it was a small scalp play resulting from price being at the upper Bollinger Band and forming a clean shooting star/gravestone bearish candle. The play was to short as soon as price broke the doji low, place a stop above the doji high, and then target the rising 20 period EMA for a successful trade.
It always works better with the @ES due to the leverage and small targets, but I show the SPY as a proxy for those trading related vehicles such as leveraged ETFs.
Honored to have you as a reader!
Right – almost a gravestone doji or shooting star, where a short-sell played mean reversion to the 20 EMA – a quick scalp trade.