SPY Intraday Triangle Breakout Go or No Go April 1
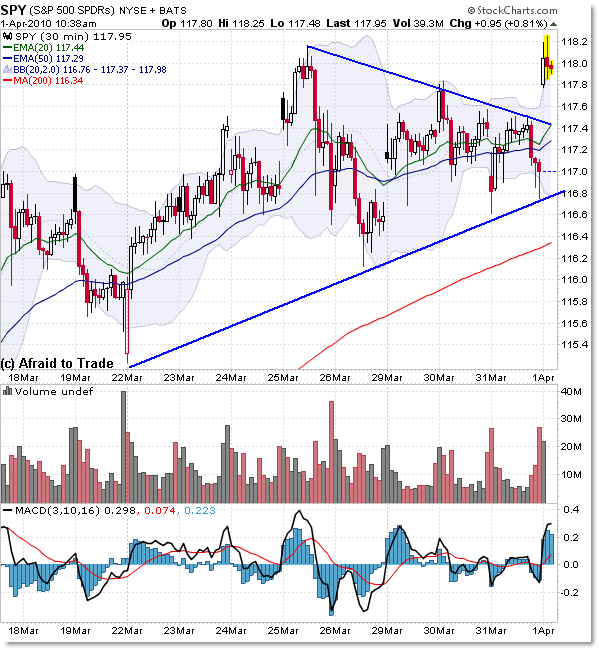
A symmetrical triangle consolidation had been forming on the intraday frame on the S&P 500 (and other markets), but this morning, we got a nice breakout of the triangle and test of the prior high.
Now, we have a “Go or No Go” on the breakout (meaning – “Is it a bull trap or for real”) which will be confirmed with a break to new highs… but let’s see the current structure and levels to watch.

I mentioned in last night’s Idealized Trades report – in the ‘forecasting tomorrow’ section – about the dominant short-term symmetrical triangle pattern, how we should be expecting a breakout forming as price neared the apex, or point where the trendlines converge.
We actually got the breakout this morning, which sent price surging to test the prior high at the $118.00 level (slightly exceeding it before pulling back, as of 10:45am EST).
We would strongly expect further upside potential if bulls can push price back above $118.20, which would trigger another round of “Popped Stops” (a short-squeeze rally as short-sellers buy to cover).
On the other hand, the pattern would fail and likely devolve into a ‘bull trap’ on a price decline back under the upper trendline at $117.45.
Let’s take a moment to zoom in on a price purism look at the triangle formation and breakout so far:

The trendline boundaries rest near the $117.45 level to the upside and the $116.80 level to the downside, though price broke out slightly earlier than expected in the pattern.
See my brief Educational Page on Triangle Patterns for more information on this relatively common price pattern.
Remember that Friday is a market holiday though the “Jobs Report” will be released, which is usually a market mover. It should be interesting to say the least!
Corey Rosenbloom, CMT
Afraid to Trade.com
Follow Corey on Twitter: http://twitter.com/afraidtotrade

Lets not get excited about a breakout here.
The market mover was the the currency traders — going back to their favorite — the yen carry trade; they sold the yen and bought all major currencies except the US Dollar; market leaders included emerging markets, energy service, basic materials, metal manufacturing as well as financial revenue shares; hence the rise was greater in the S&P than in the Nasdaq or the Dow.
Yes, there could come a move higher on the Jobs report but, but, but we are at the end, repeat end of a bull market.
The chart of distressed securities FAGIX, RWW, KME compared to TLT, … http://tinyurl.com/yjd6ed5
… for the last 12 months, shows how the swapping out of US Treasuries for mortgage debt held at banks, investment brokerages, insurance companies and others under TARP and other facilities has monetized debt, as well as stocks, and has depressed the value of US government bonds..
Investors who went long profited handsomely over the last year..
It's very likely that the yen carry trade will continue in many currencies and that Commodities being overheated will sell off; and that US Treasuries and Stocks will sell off on sovereign debt concerns; and that gold will arise as the defacto international currency and storehouse of investment wealth
For more info and today's chart please visit http://tinyurl.com/yf2lmaw
Good blog.
Your article serves as a reference.
???????????
…my blog:
http://forex-chart-analysis-and-a-cat.blogspot.com/
Your charts are beautiful.
Good blog.
Your article serves as a reference.
???????????
…my blog:
http://forex-chart-analysis-and-a-cat.blogspot.com/
Your charts are beautiful.
Charts plays and important role in the analysis of the trading and stock market. Now i am learning all the aspects regarding to forex and trading because i want to go for this field but before knowing all of its aspects. Good information is shared in this blog.
forex trading
Forex trading
techniques are imperative to traders expecting to make returns from the
business. Experts will always assert that one of the surest ways to succeed in
currency trading is known and implementing forex trading techniques.Moving Averages Forex