Pay Attention to July 25 Intraday Market Internals
With the SP500 logically retracing lower from the 1,700 level, pay attention to the mid-day picture of Market Internals and the visual divergence that undercut the sell-off for the moment.
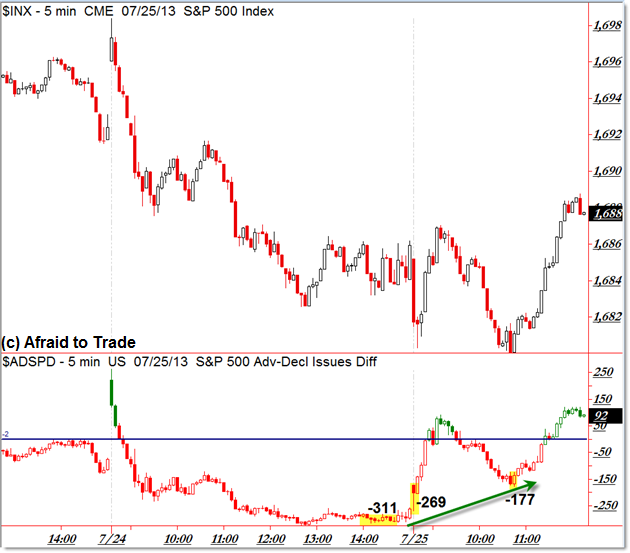
Here’s the pure SP500 Breadth or Advancing Stocks minus Declining Stocks during the session:

With the SP500 trading down intraday into the 1,680 level, a visual positive internal (Breadth) divergence developed not just in relation to the opening gap-down low (269 more stocks trading down on the session than up), but also in relation to the close of Wednesday July 24’s closing session action.
During the close, the SP500 was trading down into the 1,684 level as 311 more stocks traded lower on the session than those trading higher (in the SP500 index).
At today’s midday spike-low into 1,680, “only” 177 more stocks were trading lower on the session despite this being the third push to an intraday swing low – a great educational example for intraday traders.
While the broader index traded lower, fewer and fewer stocks were trading down on the session.
Stated differently, as the SP500 index itself traded lower, more stocks were flipping over to the positive side.
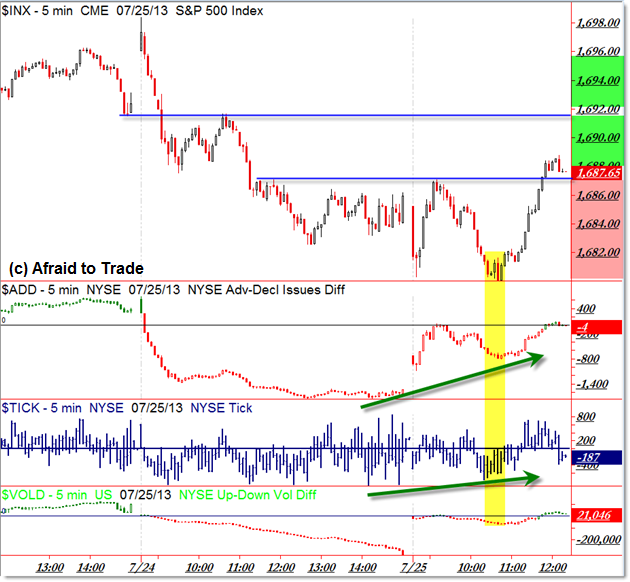
Here’s a broader picture of the “Big Three” Market Internals we follow closely:

Similarly, NYSE (broader) Breadth also showed a clear visual positive divergence with this morning’s price gap lower; NYSE TICK traded with visual higher lows (especially during the gap-down open) and VOLD Volume Differential also traded near the zero-line, well above the end-of-day activity.
The result was like a Snap-Back from a Rubber Band, resulting in a powerful impulse higher as money flowed into the market quickly.
It resulted in a horizontal trendline breakout above 1,687 which is the focal point for the rest of the session.
Further upside action and support up off 1,687 puts the market into bullish “Open Air” toward 1,692; otherwise a clean break back under 1,687 and 1,686 suggests caution and a potential movement to fill-out the intraday trading range that has developed between 1,682 and 1,687.
As the session moves forward, continue watching price relative (above or beneath) to 1,687 and the ongoing signals from Market Internals.
Join fellow members to receive daily commentary and detailed analysis each evening by joining our membership services for daily or weekly commentary, education (free education website), and timely analysis.
Corey Rosenbloom, CMT
Afraid to Trade.com
Follow Corey on Twitter: http://twitter.com/afraidtotrade
Corey’s new book The Complete Trading Course (Wiley Finance) is now available along with the newly released Profiting from the Life Cycle of a Stock Trend presentation (also from Wiley).

Corey, Nice post! What site are these charts from? They are very interesting.
Thank you! I created them in TradeStation.