Strength in NIFTY but Still in Rectangle
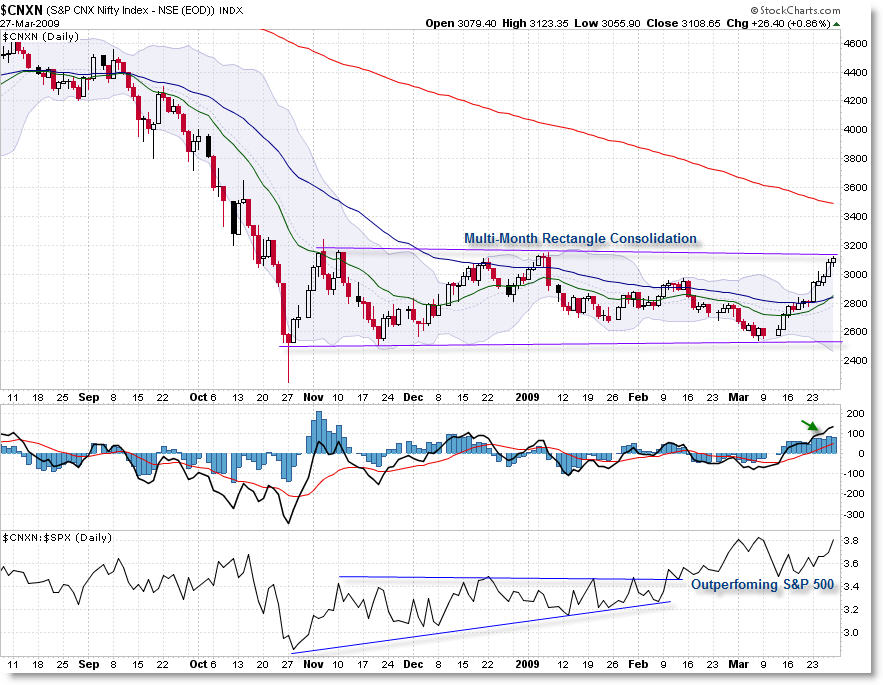
India’s Nifty Index (as well as the $BSE Bombay Sensex Index) showed great strength in its recent price swing from 2,500 to 3,100 over the last two weeks. Let’s look at the Nifty Daily Chart to see its current consolidation structure and note key points to watch.
Click for full image.
I’m sidestepping the Elliott Wave Count this week due to the complex corrective structure forming. It seems easier to refer to the recent price action as a multi-wave complex correction and fall back on basic technical analysis.
Price has formed a lengthy and clearly defined Rectangle consolidation where the boundaries established in November 2008 have held price with support and resistance until the end of March 2009.
In my experience, it’s best not to get fancy inside a lengthy flat consolidation – your best odds come from waiting for a break-out from consolidation before getting involved with a trade. In fact, the best opportunity comes when price breaks out and then retraces back to the break-out price – though we don’t always get a pullback, it is often the safest place to enter if it occurs.
That’s not to say you can’t trade within a consolidation – of course you can – but it’s often more difficult and it sometimes tends to be more stressful and you feel like you’re ‘spinning your wheels.’
The boundaries are well-established: 3,200 on the upside for Resistance and 2,500 on the downside for Support.
We’ve formed a new momentum high on the 3/10 oscillator, but that’s not as meaningful as a new high in an established up-trend.
On the bottom panel, I’m showing the Nifty’s performance relative to the S&P 500 ($CNXN:$SPX). A flat line means that the two indexes are performing in-line with each other. A rising line means the Nifty is outperforming the S&P 500.
We have Nifty outperformance really since October 2008 – remember that the S&P 500 made a new low in March and the Nifty did not. Thus, the Nifty is showing strength on a relative basis. The Nifty also broke a consolidating trendline in Relative Strength in February which set the stage for outperformance to present.
I hate to be overly simplistic in my analysis this week, but the structure is clearly defined and the implication is that once price breaks out of the rectangle (be it on the upside or the downside), then odds favor a trend (or momentum) move to carry in that direction for some time. Until then, odds favor waiting for the break or risk getting chopped around too much in your trading.
Corey Rosenbloom
Afraid to Trade.com
Follow Corey on Twitter: http://twitter.com/afraidtotrade
Travel to the LA Trader’s Expo in June to hear Corey speak on “Idealized Trades for Intraday Traders”
Corey,
Would be interesting to have your view on SSE, the Shanghai Stock Composite. Thanks in advance.
Amazing! Definitely.
I’m wondering if a full 5-wave structure completed already.
I’ll post it later this afternoon. Thanks.
i am waiting for nifty to do a shanghai(SSE).. but now it seems difficult..
i missed this rally as i was waiting for more downside targets. i planned to invest heavily, had nifty hit sub 2000 levels or atleast near it, but it took a U turn at 2500
Corey,
There is a Negative Momentum Divergence in Nifty hourly charts.Even such divergence are reflected in Dow Hourly charts too.
Looks some profit booking should take place for both US and Indian Stock Markets in near term
Raivo Pommer-eesti-estonia-www.google.ee
raimo1@hot.ee
G-20 Meeting
Seit die globale Finanzkrise die Menschen in Schock versetzt hat, ist die Marktwirtschaft ziemlich in Verruf geraten. Kein Wunder, dass viele hoffnungsfrohe Apokalyptiker jetzt das Ende des Kapitalismus nahen sehen. Werden wir heute zu Zeugen des kapitalistischen Zusammenbruchs, so wie wir vor zwanzig Jahren das Ende des sozialistischen Systems erlebt haben? Selbst ehemalige Freunde der Marktwirtschaft wie Bundespräsident Horst Köhler singen nun laut im Chor der Skeptiker mit. „Wir können uns nicht mehr hauptsächlich auf wirtschaftliches Wachstum verlassen“, gab Köhler vergangene Woche in seiner „Berliner Rede“ von sich. Für die „Grenzen des Wachstums“ sind die Deutschen allemal empfänglich.
Wo der Bundespräsident zum Zweifler wird, überrascht es nicht, dass andere noch viel radikaler urteilen. Michail Gorbatschow, der letzte Staatschef der kommunistischen Sowjetunion, ist sich sicher, dass das „in den frühen achtziger Jahren verankerte Wirtschaftsmodell“ sich jetzt auflösen werde: „Es basierte auf der Maximierung von Profiten“, weiß Gorbatschow in gut marxistischer Tradition: „Jahrzehntelang wurde uns gesagt, dies komme uns allen zugute. Doch wie die Statistiken belegen, war dies nicht der Fall.“
Anon,
It looks like the Shanghai completed its 5-wave structure down and – a basic/simple look at the Nifty shows we might be in Wave 4. There’s a discrepancy there, but by all means it’s possible that the Nifty has completed a 5-wave decline but it’s harder to read that into the Wave Count.
Rajandran,
Odds seem overwhelmingly to favor a pullback of some sorts perhaps into support on both indexes. There’s lengthy divergences in them both on the intraday charts.
Both are at key resistance levels currently.
Check my post corey, I saw this on Mar 18…great somebody agreed with my analysis…
http://man4urheart.blogspot.com/2009/03/nifty-riddle.html
Man4urheart
raivo pommer-www.google.ee
raimo1@hot.ee
Deflation hits Ireland
Ireland’s consumer prices fell 2.6 per cent in March from a year ago, the sharpest rate of deflation since 1933, when the world was struggling through the Great Depression, official figures showed yesterday.
The March rate accelerated from an annual deflation rate of 1.7 per cent in February, the Central Statistics Office said. The report said there was no change in prices from February to March, which are now at August 2007 levels.
Ireland’s deflation began in January and reflects the country’s sudden fall into a deep recession.
The country last suffered from deflation in 1960.
Although lower prices can help spending and exports, deflation can be damaging for an economy if prices enter a downward spiral – consumers hold off buying items on expectations they will become cheaper, pushing retailers to cut prices to encourage spending, and so on.
Finance Minister Brian Lenihan, when announcing an emergency budget on Wednesday to trim 3.25 billion ($7.32 billion) from Ireland’s ballooning deficit, said the Government expected deflation to average 4 per cent in 2009.
raivo pommer-www.google.ee
raimo1@hot.ee
SLOW- MOTION
Federal regulators on Friday will privately begin telling the 19 largest US financial institutions how well they performed in stress
tests to assess their soundness.
Regulators trying to stabilize the financial system also will release the test methodology they used, which could provide clues about which banks may be in trouble – but also could could unwittingly roil the industry.
The results of the stress tests won’t be publicly released until May 4.
The slow-motion rollout is intended to blunt market reaction to the news of which banks are healthy, which ones could fail if the recession worsens and which need more money to survive.
News reports, including a confidential outline of the tests first reported by The Associated Press this week, have led analysts to start handicapping which banks could fail. The speculation will intensify with Friday’s release of the test methodology.
“I’m worried about the overreaction – people selling every bank short and pulling out all their deposits and hiding their money in the mattress,” said Scott Talbott, a lobbyist with the Financial Services Roundtable, which represents the biggest financial firms.
Regulators are striving to release enough information about the stress tests to inspire confidence. But they don’t want to give analysts so much detail that they can run their own tests on the banks before the official release of results.
JAPAN SOFTBANK
Softbank, now with about 20.6 million subscribers, controls about 19.2 percent of the nation’s market, up 1.1 percentage points from the previous fiscal year. But average sales per user declined for voice calls, while they were up for data transmission.
Losses on investments from the market downturn dragged on its earnings, according to Softbank, which bought British cellular giant Vodafone Group PLC’s struggling Japanese operations in 2006.
A major one-time loss related to payments for bonds for its mobile unit as well as a write-off for its optical fiber Internet services, also hurt results, it said.
One business area that performed better than last year was its Internet-related “cultural” businesses such as advertising, Internet shopping and auctions, Softbank said.
Softbank also introduced attractive mobile content such as video of comedy acts popular in Japan called “S-1 Battle,” and easy-to-use applications called “mobile widget.”
For the fiscal year ending March 31, Softbank’s profit dropped 60.3 percent to 43.2 billion yen, on 2.67 trillion yen in sales, down 3.7 percent on year.
Softbank did not give a net profit forecast, but expects operating profit for the fiscal year ending March 31, 2010, to rise 17 percent from the fiscal year just ended to 420 billion yen.
The European Union on Tuesday doubled a bailout fund for member states in trouble to euro50
billion.
Hungary and Latvia have already received euro9.6 billion from the fund, which raises money by selling bonds.
Romania is seeking euro5 billion from the EU as part of a euro20 billion joint rescue package from the International Monetary Fund and the European Bank for Reconstruction and Development.
EU nations are expected to approve the Romania bailout this month.
The EU fund can bail out the 11 EU nations that don't use the euro, most of them eastern European countries. EU governments backed the increased limit on Tuesday, the final approval after the European Parliament supported it last month.
Germany initially opposed raising the limit from euro25 billion, only months after hiking it from euro12 billion. But the new limit aims to reassure eastern European nations that help is available from the European Union as a recession deepens.
The economic crisis has put the squeeze on many countries' finances, sending yearly budget deficits and overall public debt soaring as tax revenue plunges and social welfare payments climb sharply to help out the rising number of jobless.
Citigroup Inc. is using its $45 billion in government capital to make nearly that much in new loans.
Citigroup said its committee overseeing the use of taxpayer money approved $44.75 billion in lending initiatives as of March 31. That is up from the $36.5 billion in lending initiatives announced in February, and now includes $5 billion in loans to municipalities.
The loans being offered by Citigroup to state and local governments, municipal agencies, universities and non-profit hospitals would not likely have been made had the bank not received money from the Troubled Assets Relief Program, or TARP.
David Brownstein, Citigroup's managing director and co-head of public finance, said in an interview with The Associated Press that these municipal borrowers are still very secure, but their borrowing costs have shot higher because of turbulence in the credit markets.
In Citigroup's report, reviewed by the AP and scheduled for release Tuesday morning, the bank also said it is spending $2 billion more to finance suppliers, $1 billion more in residential mortgages, and $250 million more in auto loans.
In total, Citigroup has extended more than $200 billion in new credit in the United States since last October _ when the bank got its first $25 billion injection of bailout money from the government. Last fall, Congress approved the $700 billion TARP fund, which got handed out to hundreds of financial institutions in an effort to stabilize the financial system and revive lending.
Banks like Citigroup do not lend the TARP money directly to borrowers. Instead, the banks keep the extra capital on their books, which allows them to borrow more money from funding sources. Then, they lend that borrowed money to others. A bank makes money by borrowing cheaply for the short-term and lending at higher rates for the long-term; if a bank has no capital, other institutions and investors won't lend to it.
In November, Citigroup got an additional $20 billion, bringing its TARP total to $45 billion. In February, it agreed to convert a portion of the TARP investment from preferred stock to common stock.
After the government's funding and other capital raising efforts, the Federal Reserve found last week in its “stress test” of the country's 19 largest banks that Citigroup has a capital shortfall of $5.5 billion. Citigroup said last week it plans to make up that shortfall by converting more preferred stock into common stock.