The Fallout from Wednesday’s Fed Meeting
With all the spastic intraday moves that resulted from today’s Federal Reserve announcement (assessment of the economy – that it is contracting; that rates will be kept low; and that the Fed will buy treasuries) there were some major moves in the Stock Market, Bond Market, Gold (and Silver) Market, and US Dollar Index. Let’s take a quick look at some examples on the daily chart to get a quick glance on what might be changing as a result.
Quick comments and charts only –
S&P 500:
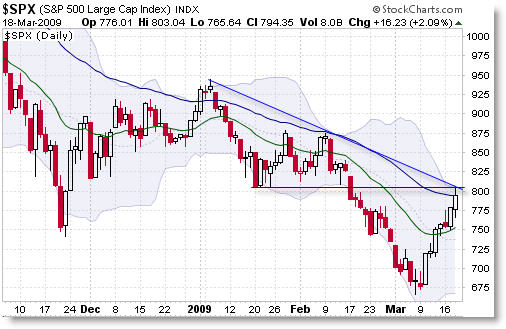
Quick Take: Key resistance at 800 (804). If broken, it would be a major feat for the bulls. We have prior support, a declining trendline, and confluence Fibonacci at the 800/805 level. All eyes are on this level.
Gold:
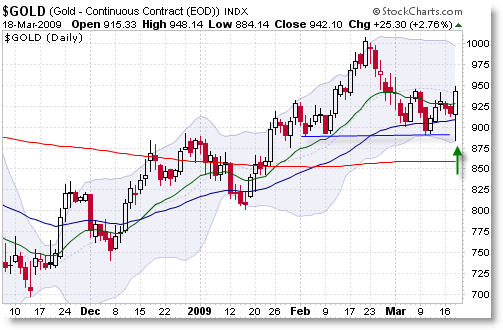
Quick Take: Sharp spike (like silver) down in the morning – massive recovery after the announcement. Price is still in a range consolidatioin – a break above $950 could send us immedaitely up to challenge $1,000 with little effort. Price is still in an uptrend, after all.
TLT (20y T-Bond Fund):
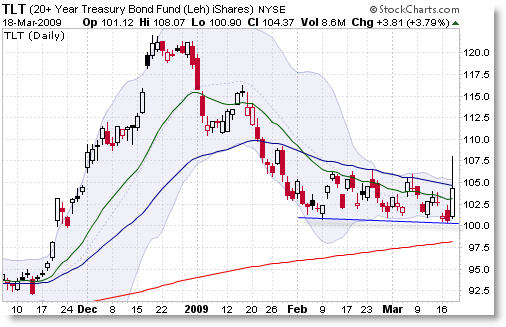
Quick Take: Price – like gold – is still in a range consolidation (rectangle). We had a sharp spike outside the range today which quickly took us right back inside the consolidation. There’s key support about the $100 level, though the upper trend-channel (which is the 50 day EMA) is declining. For now, it looks slightly more bearish than bullish – though a break above $105 will test the ‘open airs’ above and could rally back to $120.
US Dollar Index:
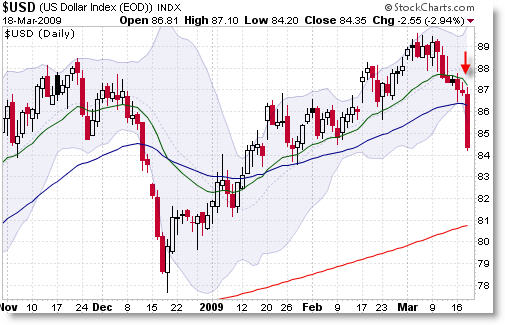
Quick Take: The Traders who got hammered the worst today – at the close that is – were the US Dollar Bulls.
Price sliced through the 50 EMA support like it wasn’t even there and now we’ve opened up the possibility to test the rising 200 SMA at $81 (or weekly 50 EMA at $82). A bullish picture just last week is now shattered and odds seem to favor lower prices for the meantime.
What a day. Remember the end of this week brings us “Quadruple Witching” where futures, index, equity, and single stock futures options all expire – the main take-away is that we’re likely to see large volume and erratic price movements as large funds square away their positions.
By all means be careful out there.
Corey Rosenbloom
Afraid to Trade.com
Follow Corey on Twitter: http://twitter.com/afraidtotrade
Register (free) for the Afraid to Trade.com Blog to stay updated
do you see flags on silver and gold with breakouts being today and yesterday?
also, i see lots of overhead resistance for silver and almost getting to overbought. i see possibly we go up some more turn back and test trendline then go higher? any thoughts. tbt tlt didnt do much to confirm either way and dollar has 200 dma support
Anon,
It would appear we got a bull flag breakout on the daily chart of SLV and GLD, with a minimal target being at least a test of the highs if not beyond (in both).
For both, they’ve cleared daily EMA resistance and trendline resistance so there seems to be ‘open space’ all the way up to prior highs, which should serve at least as initial resistance. This is a big move and momentum is on the side of the bulls at the moment.