Update on Exxon Mobil XOM Support Break Jan 28
With Exxon-Mobil breaking down through critical support level at the $67.50 level, let’s take an updated look at Exxon-Mobil and note a key target and potential bear flag development in this stock.
Reference back to my prior January 3rd post “Exxon-Mobil Must Stay Above Critical Support (or else)” for the prior update.
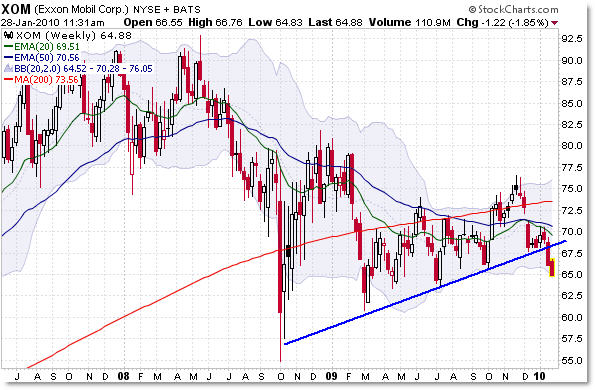
First, let’s start with the weekly view of Exxon-Mobil:

The weekly chart highlights the lengthy lower trendline that began from the October 2008 lows… and is now broken.
The price breakdown of a lengthy, confirmed trendline can be a major turning point in a market, and if that holds true, then we could see Exxon-Mobil slide to test all prior support lows back to the $60 level and even beyond.
Price rests precariously on the lower Bollinger Band ($64.52), and that indicates an ‘oversold’ position, but if this develops into a trend move down, no support level will be safe.
Continue to monitor XOM on the weekly frame for additional clues.
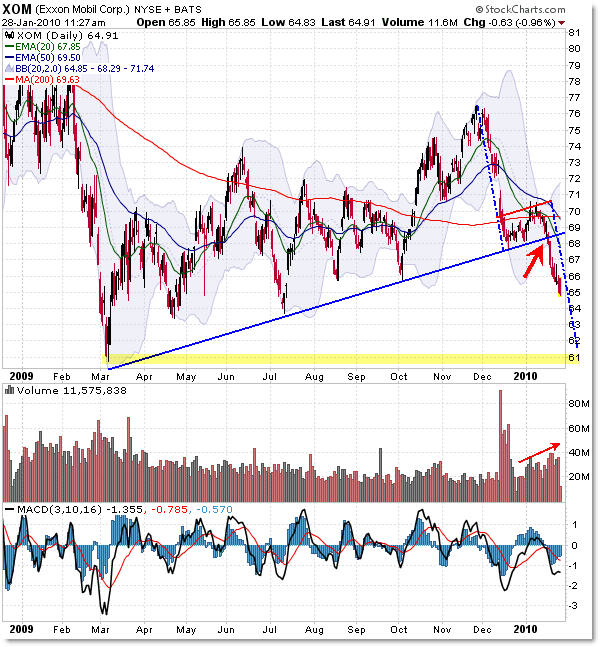
Next, let’s take a look over the last year of trading activity and note the trendline and flag formation:

I wanted to highlight the lengthy rising trendline, and how the sharp sell-off began once this obvious level was broken (drawing in new short sellers and causing buyers to stop-out under critical support).
Volume is rising relatively as price is selling-off, so keep an eye on volume – rising volume during a sell-off is often a bearish continuation sign.
Otherwise, I’m showing a potential bear flag price pattern as labeled, with the final price projection low to target $61.50, which also happens to be an expected critical support zone from the March 2009 lows.
Continue monitoring the price to see if sellers can drive the stock price down to this level – it would be likely if the broader market continues selling off as it is.
Finally, let’s zoom in to see the recent sell-off which was forecast in the event the critical support line broke:

I wanted to use this chart mainly to illustrate the principle of why it is important to monitor ‘obvious’ or key support levels (such as trendlines) and keep an open mind.
Price can either ‘bounce’ off a trendline (as it tried to do in mid-January) but once the trendline is officially broken (often with a powerful close under the level), then a process of “Positive Feedback” kicks in which sends price sharply lower.
Positive feedback (loop) is defined in charting as sellers shorting while buyers are stopping out (selling) – or in essence both bulls and bears are doing the same thing at the same time (it also occurs during sharp rallies above resistance).
We can learn two lessons from the breaking of a critical support level:
1. Take your stop-loss quickly if you are caught on the wrong side of the break.
(Do NOT double down or try to give the market room – price can sell-off violently when caught in positive feedback)
2. Be prepared to enter short quickly on a break of key support
(For the same reason, you can take advantage of a likely feedback loop as an intraday or swing trader by entering aggressively on a suspected break)
Let’s keep monitoring Exxon-Mobil to see how this plays out now that support is broken and lower targets are possible.
For my prior analysis posts on Exxon-Mobil, see the following:
August 10, 2009: Triangle Trendline Lesson in Exxon-Mobil
September 21, 2009: Symmetrical Triangle Forms in Exxon-Mobil
September 30, 2009: An Update on that Pesky Triangle in Exxon-Mobil
October 15, 2009: Update on the Triangle in Exxon-Mobil
January 3, 2010: Exxon-Mobil Must Stay Above Critical Support (or else)
Corey Rosenbloom, CMT
Afraid to Trade.com
Follow Corey on Twitter: http://twitter.com/afraidtotrade

Great information. Can you do one on consolidation breakouts? Thanks!
Some of the prior posts listed above in XOM address consolidation breakout plays.
Otherwise, I'll look for other examples. Thanks Terry!
Thank you, Corey, for being so responsive. I'm working hard to isolate and identify what I'm not getting, watching the charts, and hope that at some point I'll actually be able to make some money trading. 🙂
Corey,
What happened to the bearish flag that pointed to a drop in price to as low as $35 or $40?
Corey, Thanks for this article on Exxon Mobil, XOM, as it documents a historically important investment change — wealth can no longer be garnered by investing in dividend paying stocks.
Your article shows the company's stock breaking down through critical support level at the $67.50 level on January 21, 2010; it closed this week at 64.43 paying $1.68 per share which is 2.60%.
Canaries in the stock market coal mine are relating it's time to exit stocks and bonds.
It was on January 11, 2010 that the S&P International Dividend ETF, DWX, fell from it's rally high of 57.49; and it was on January 14, 2010 that the International Mid Cap Dividend ETF, DIM, fell from it's rally high of 50.11.
A rising yield curve, as evidenced by the TMF to TYD spread, that is the spread between the 30 Year US Treasury and the US Ten Year Note, as seen on Stockcharts.com chart, rising from 0.65 on January 11, 2010, has soured investor risk appetite for borrowing to invest in stocks, as well as holding stocks.
Investors have been seeking safe haven in the the US Dollar, UUP, and the Yen, FXY, since January 14, 2010 as seen in MSN Finance Chart http://tinyurl.com/ybpdb6e
Soon investor's risk appetite for gold will increase as the USD/JPY turns down and as the yield curve continues to increase.
I strongly encourage investors to cease all brokerage trading and invest in the gold ETF, GLD, held in a trust account not at a brokerage account, British Sovereign gold coins and purchase gold at BullionVault.com.