Update on The Arc and Bounce Rally in Gold
Last week, I showed a chart of Gold’s Arc entitled:
“The Arc Pattern and Support Test in Gold.”
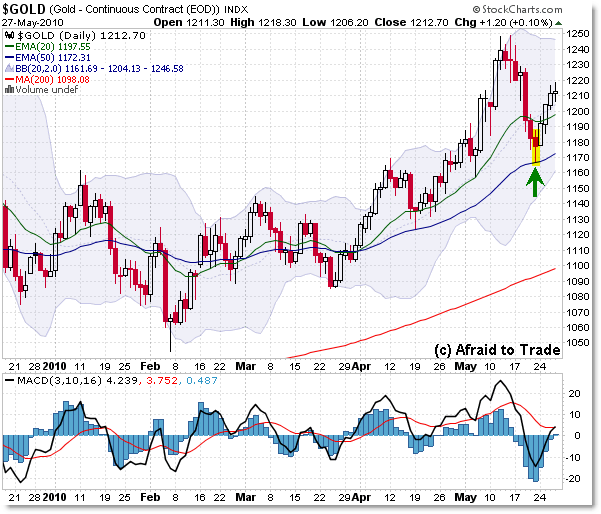
Price has bounced off the arc and key support at the $1,170 level, as shown below in the updated chart:

We had arc support (shown in the chart below) and the support off the rising 50 day EMA. Friday’s candle also formed a sort of (not perfect) lower-shadow hammer candle, more akin to a spinning top.
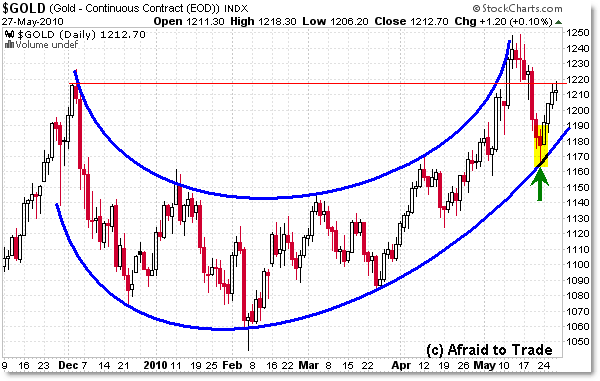
This week gave us a bounce off that key level and back into the small resistance level of $1,220 from the prior swing high of December 2009:

This chart also updates the arc pattern, showing we’re at the late stage of a Mirror Image Foldback.
For the “IF/THEN” analysis, if buyers can push back above the $1,220 high, then we could certainly see a return to $1,250 or beyond.
Today – though it’s not shown in the chart (StockCharts updates end-of-day only for gold prices) – we’re seeing a bit of selling in gold by mid-day.
Thus, the level now to watch is the $1,190 which is the rising arc support, and then the $1,180 level which will soon be the rising 50 day EMA.
I’ll discuss the monthly and weekly charts of gold and show more detailed analysis in this week’s Inter-market Report for members.
Corey Rosenbloom, CMT
Afraid to Trade.com
Follow Corey on Twitter: http://twitter.com/afraidtotrade

Charts and investment research shows that gold has risen as the defacto world currency and storehouse of investment wealh … http://theyenguy.wordpress.com/2010/05/28/gold-…