Updated Arc Patterns on the Daily US Equity Indexes Reference
In keeping with the last two update posts on the “Rounded Arc on the NASDAQ April 9” Index (short-term) and Rounded Arc on NASDAQ from March 30, I’ve received a few comments asking about the larger pattern of a rounded arc not just on the NASDAQ, but other equity indexes.
And you’re right – there are large-scale arcs on all US Equity Indexes (Dow Jones, Russell 2000, NASDAQ, and S&P 500) starting with the March 2009 low and moving one-year later to the present.
Use this post as reference grid for what the current arcs look like – as well as a reference on a pure price approach to the 2009 major Rally.
Click on all charts to view them full-size.
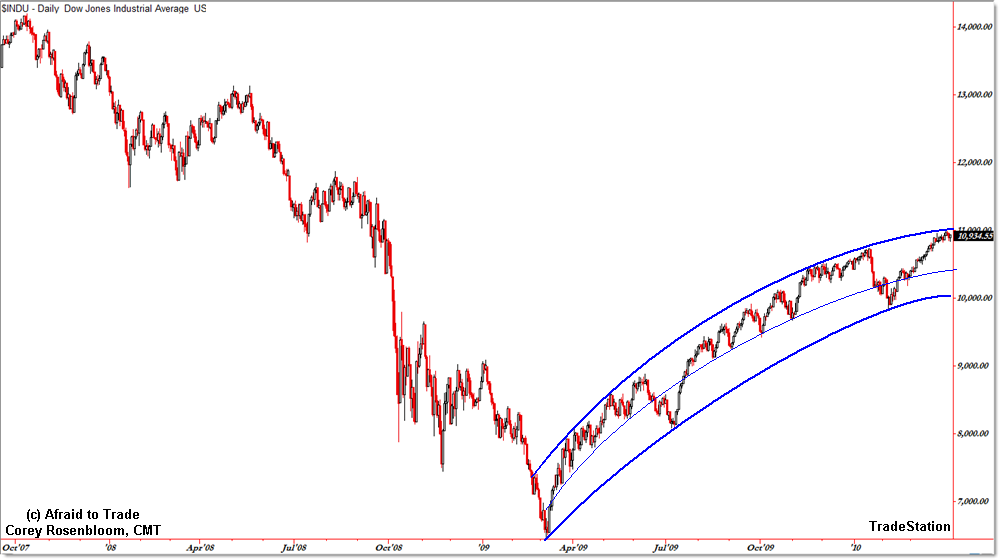
First, the Dow Jones:
The Dow Jones actually has an internal arc as drawn, connecting the smaller swing lows inside the larger formation.
Unlike the other indexes, the Dow Jones is the only one to remain reasonably within the boundaries of the arc.
Next, the NASDAQ:
The NASDAQ has a clear arc pattern (as a reader mentioned), but price has burst outside the dominant arc recently, which is either a sign of exhaustion, or that momentum is picking back up to invalidate the arc pattern.
Any return back inside the arc should be expected to take price down to the 2,200 level again, but let’s see if buyers/bulls can support price above the upper arc at the 2,400 level – that would be interesting.
On to the S&P 500:
Unlike the Dow, I actually combined the two arcs into a broadening arc.
You actually can draw the lower arc as I did on the Dow Jones and then draw the middle arc to connect the smaller swings. That would take care of the ‘thrust’ outside the lower boundary in July.
Even so, it shows that thrusts outside pattern boundaries are often met with a return back intside the parameters of the pattern… suggesting that if sellers crack price back under 1,150 (the upper part of the arc), then we’d expect to see a move back down to the 1,100 level.
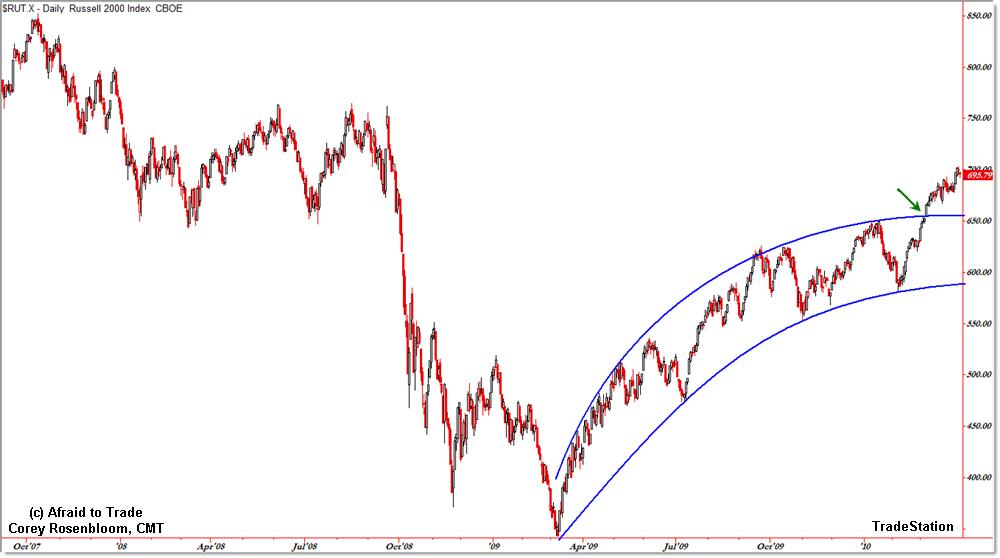
Finally, the Russell 2000:
While the Russell had clear trendline boundaries going up, the small-cap index is also breaking solidly above the upper boundary like the NASDAQ.
Let’s see if buyers can hold above the pattern high at the 630 level, but if not, let’s see a move back down to the 600 area.
Like trendlines, the goal of an arc – which is really just a curved trendline – is to touch as many price points as possible. They’re not meant to be perfect or magic – just a way to show sloping and evolving trendlines that change as the market changes.
I’ll continue to keep you posted on any major changes in these structures.
Corey Rosenbloom, CMT
Afraid to Trade.com
Follow Corey on Twitter: http://twitter.com/afraidtotrade


Have you read the “rare wave structure” in EWI april forecast? If so what do you think?
<a href=”http://sharetipsinfo.com”
title=”Indian stock market
recommendation”>Indian stock market
recommendation is one of the fastest
growing markets. Major stock exchanges like
NSE and BSE are also growing in terms of
volume, traded contracts and turnover on
regular basis.
Now the question is how to select best stock
pic of the day for intraday trade and
positional trade? In this regard sharetipsinfo
comes into the play.
At Sharetipsinfo we assure you high accuracy
and our tips are based on technical analysis.
Once you comfortable and gains confidence than
no one can stop day traders and investors from
earning profit from the stock market.
Have confidence and trade without emotions and
see how things changes for you in short while.
For any query feel free to contact us
Regards
<a href=”http://www.sharetipsinfo.com/”
title=”sharetipsinfo”>sharetipsinfo
Just wondering if the rounded arc will be seen as a regular straight line if you see the chart on a logarithmic scale ?
Just wondering if the rounded arc will be seen as a regular straight line if you see the chart on a logarithmic scale ?
Dear Visitor,
Market is showing some good move. Nifty traders are now confused if they should go short in Nifty from current level of 5400 or should go further long. NSE and BSE are the two major stock exchanges of Indian stock market. Keeping in mind that many investors and traders are very much confused with the current market move, we have stared posting ” title=”technical research reports”> technical research reports These reports are highly accurate and are available for free.
Regards
Stock market investment if done with proper research and updated knowledge than it can give very lucrative results. There are four basic golden rules of stock market which are to be followed. (thebuzzingstreet1@gmail.com)http://www.buzzingstreet.com
Nifty is on its peak now and is turning volatile. Investors are suggested to book long delivery positions soon. As after some more upmove we can see profit booking in the market soon. Investors are suggested to grab quality stocks at lower level again.
Hi , Very good information you are providing at here . Thanks for your knowledege , it vreally helps me a lot.
Regards
Anjali
http://www.forexlore.com
If you are trading in NSE, BSE, MCX and in NCDEX then let sharegyan give you all stock trading gyan
If you are trading in NSE, BSE, MCX and in NCDEX then let sharegyan give you all stock trading gyan