Bearish Rising Wedge in the SP500?
Is a Bearish Rising Wedge forming in the S&P 500? Let’s turn to a pure price look at the S&P 500 index to see this structure potentially developing.
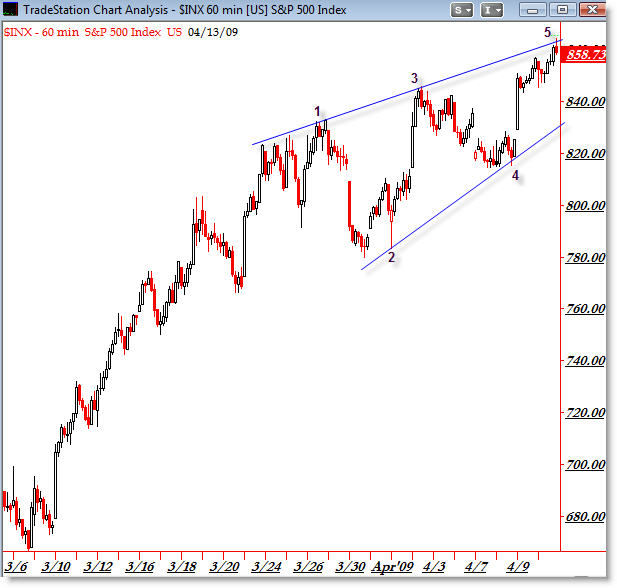
When trying to be bearish in any degree off the March 6th lows, it’s as if the bulls are saying “Rumors of my death have been completely exaggerated,” as any attempt to call a top has been hideously thwarted, so that’s a caveat when reading a bearish rising wedge into the patterns. However, taking a technical purist approach, we do see the clear formation of a rising wedge potential reversal pattern.
Also, in Elliott Wave terminology, one could refer to this as an “Ending Diagonal” of sorts (which has the same implications as a bearish rising wedge).
The expectation is that price and momentum is winding down and bulls are giving it ‘one last go’ within narrowing trend channels. We should expect a down-move breakout impulse should sellers/bears push price underneath the lower trendline around 830.
Furthermore, unless we have ‘pattern failure,’ then bulls should not be expected to push price outside the upper trend channel at 870 or so.
Even stepping aside the larger pattern, just using converging trendline analysis, it seems logical to expect the next ‘play’ to be down to test the lower rising trend line for a test of support (or type of “magnet trade”.
Keep watching the simple price structure to see what develops and whether or not bruised bears can wrest control away from drunken bulls.
Corey Rosenbloom
Afraid to Trade.com
Follow Corey on Twitter: http://twitter.com/afraidtotrade
Travel to the LA Trader’s Expo in June to hear Corey speak on “Idealized Trades for Intraday Traders”
From an EW standpoint if you believe that a wave 3 completed in November at 741 then it is possible we are in a wave 4 correction. In this case the A wave would have been 741 to 944, B from 944 to 667, and C from 667 to wherever this bull ends. The A move was 203 points and the C move at 864 (yesterday) is 197.
A limit at 870 as you suggest would give a perfect A=C move of 203 points. Interesting stuff. A move lower in the near term is a near certainty but whether we see a break above 870 first is the next decision point for the markets. Based on other technicals, RSI is toppy but not extreme, yesterday quite a Doji star day but it was nearly so; based on these tea leaves I lean moderately bearish with a view to another test of 870 as possible.
Hi Corey, also noticed the wedge forming on the S&P here. I’ve heard some compare this to the 1982 melt up, although I am not convinced of that. Interesting thing to note about 1982 was how we bottomed out, formed a bearish wedge, eventually taking that wedge out with a move UP and OUT, esentially turning that wedge into support. Just something to keep in mind… a move up and out surely would have the bears on the run, although I still think we have downside left in this bear.
ABCs,
That’s sort of the dominant interpretation I’m taking – that we’re in primary Wave 4.
I had not done the price comparison of swings – thank you for sharing – very good insight.
I’m expecting this 4 to challenge potentially the 1,000 level, so I’m not (yet) expecting this next swing down – if it ever comes! – to make a new low just yet.
But, I try to take it day by day in my trading and analysis.
Hello Corey, is chart on yrwc impulse buy ? looks like impulse pole up, bull flag , and 2nd pulse up , is this correct ? also transports are not confirming indu, is this near term top ? thanks, im learning from your posts , thanks.
Mark,
I’m going back and looking at the 1982 pattern and there are indeed similarities, with an initial breakdown and then surge to the upside. I’ll try to post this pattern later on the blog.
Any move to the upside will continue to be painful for the bears, which have been tricked many times (I’ve been one of them!) so I’m expecting bears to capitulate (buy to cover) en masse if this wedge fails. Maybe it will be the ‘final nail in the coffin.’
Mark,
What do you mean by yrwc? I couldn’t call up a stock with that symbol.
Transports not confirming Industrials would indeed be a non-confirmation (in terms of Dow theory) and suggest price weakness ahead.
Corey,
Good to know others are thinking along the same lines (yay groupthink!). But seriously, I also thought 1,000 was a possible target as 995 represents 1.618 times the A move. I’d say I’m currently leaning against this view as the number of days in this wave increases but obviously a solid sustained move 870 would change my mind.
Good luck, I enjoy your posts.
sorry corey, thats yrcw for yellow trucking
ABC,
haha I’d be wary of group-think 🙂 Always a contrarian.
1,000 is just a round number to imply possible movement – I like the 995 precise target as it is a Fib relationship.
One thing I need more help on is the timing analysis (cycles, etc). I’ve rarely had much luck in that type of analysis.
Mark,
Oh ok. Hmm. Just came off a Cradle Buy on the daily chart but the 60min is breaking down. If it breaks down from here, it would be a Bear Flag (a cradle has already formed on the 60-min) so we have a conflict in timeframes. Looks bullish (you’re right – impulse buy and EMA support below) on daily and bearish on 60min down.
I’d have to punt on this one. Would be bullish if the daily structure held support where it is. Any break of EMA support would throw it into the bearish camp.
Corey … haha …loved the expression “bruised bears and drunken bulls” …. Anyways, Excellent post again, u r quite right about the wedge, lets see how it plays …
Cheers
hey corey, i was looking at yellow for the first hour and a half from the open, looked like pole to a flag to a pole to me , im on scottrade so i only have min sixty and 5 min daily and up , interesting with the 20 and 50 averages, am watching and learning more , missed a pullback on faz to 10.02 on bullflag with a target of 10.70 from first pole , but was gun shy , looking for something now, thanks mark.
Neil,
Thanks! I thought I’d add a little color to the post to make it more lively.
It can also be interpreted as a rising trend channel, but it seems to have a wedge character to it – at least for the time being.
That’s bearish – unless price breaks out of the up-channel unexpectedly.
Mark,
Oh ok. I wasn’t sure of the timeframe you were seeing.
Right – patterns (and their targets) are relative to the timeframes, though the higher timeframes tend to dictate the outcome most of the times.
Good call!
Hey Corey, is there any way you can tear apart the last 2 hours of trading on faz? I was looking for a pullback after the high of day, checking the 1 min daily and the 5 min daily on my scottrade with the 20 and th3 50 averages, i jumped in after the 20 came up thru the 50 on the min chart, bought 10.63 , they then attached bags of rocks to both of my legs and thru me in the water, i broke loose long enuff to double down at 10.35 , and almost drowned at 10.15, looked like a divergence in the volume so i hung in there,looked to have an impulse up thru the averages again with a small bull flag, i was getting encouraged at this point, boom flagpole up to another flag at 10.70 to 10.90 area, measured out and was looking for 11 ish and sold into the frenzy at 11.10 before the close , when i seen them flags,thanks to you, i felt good after reading alot of your stuff over the weekend, anyways , would like to hear from a pro and tell me what i did right and wrong , thanks corey. mark
Interesting.I covered my IRA portfolio yesterday and am waiting for a pullback.We’ll see if that was a wise move.
Mark,
Looks like a large 5-wave pattern, where the last hour or so was an ABC correction which led to the final 5th wave up. I know that oversimplifies it.
http://www.twitpic.com/3c8cc
That’s the best way to explain it.
There was a Cradle early in the day, and a negative divergence forming the 5th fractal wave of the larger W3 in the structure.
The late-afternoon push beneath the EMAs likely stole away stops which I know was very frustrating.
here we are late in october…how did that wedge work out for you after another 240 points on the sp?…so much for technicals having any valid logic…its just a pattern guessing game.
Even taking your assumption, turn it into a coin toss.
Heads, you get $2,000, tails you lose $1,000 (or $500).
Even if a patterns work 50% of the time, the edge comes from the stop and the target, given that the target is at least 2 times (or 3 times) the risk or stop. Simple edge, expectancy, and probability.
here we are late in october…how did that wedge work out for you after another 240 points on the sp?…so much for technicals having any valid logic…its just a pattern guessing game.