Charting an End of August Key Support Level for Google GOOG
As August winds to a close, let’s take a quick look at a key chart-based support or inflection level for shares of Google (GOOG) both on a Daily and Weekly planning chart.
We’ll start with the Daily Chart which highlights the key inflection point best:

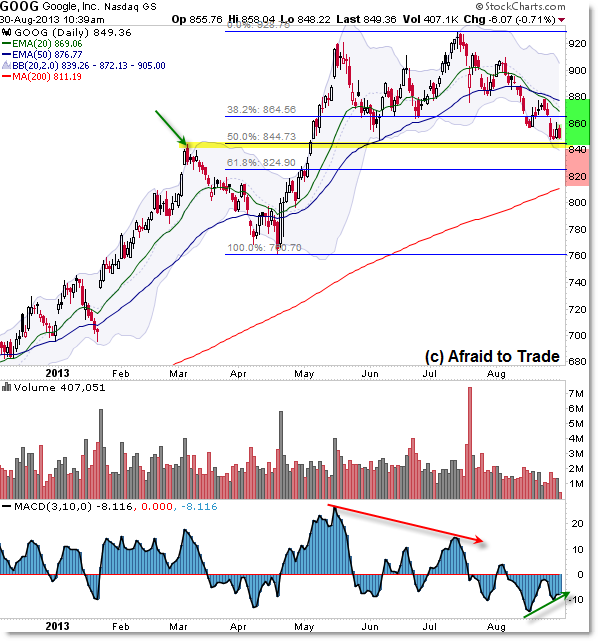
After a “Cradle” Sell Trade into the cross-under of the 20/50 day EMA into $880 per share, Google shares have fallen to the next critical support or inflection target at the $845 per share level.
We’ll focus on this level due to the overlap of the March 2013 swing high with the 50% or “halfway” Fibonacci Retracement of the April to July rally phase.
Two other chart-based factors suggest a support bounce may occur – the slight positive momentum divergence and the test of the lower Bollinger Band.
For trade or strategy planning purposes, we’ll simply refer to this as a key inflection or focal point for price where the bullish or “support-bounce” thesis calls for a short-term bounce up off this level.
The alternate or “bearish breakdown” thesis calls for a quick short-sell or downswing to target the $825 confluence or the rising 200 day SMA.
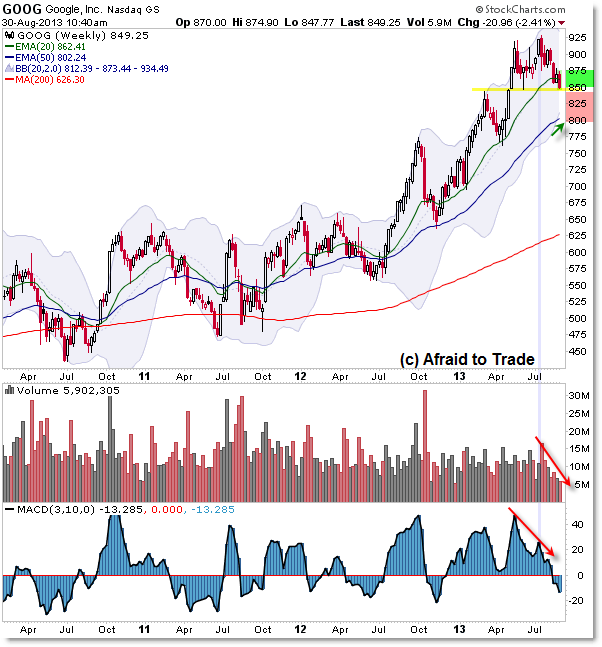
We can see how this bearish thesis can play out – should it occur – on the Weekly Chart:

Again, we see the importance of the prior swing high level into $845 but note that price already broke and closed under the rising 20 week EMA at the $860 level.
Should sellers continue their aggressive movements, Google would extend its downside target toward the rising 50 week EMA and lower Bollinger Band confluence near $800 per share.
Just like we pieced together the puzzle for the Daily and Weekly S&P 500 chart earlier this week, be sure to integrate the Daily Chart potential support level but if it fails, it opens a pathway lower via the Weekly Chart “Open Air” breakdown.
Join fellow members to receive daily commentary and detailed analysis each evening by joining our membership services for daily or weekly commentary, education (free education section), and timely analysis.
Corey Rosenbloom, CMT
Afraid to Trade.com
Follow Corey on Twitter: http://twitter.com/afraidtotrade
Corey’s new book The Complete Trading Course (Wiley Finance) is now available along with the newly released Profiting from the Life Cycle of a Stock Trend presentation (also from Wiley).

Which is the best trading software?
Hey a while ago I was looking for the best trading software. I searched for a few days, and this is the best one of them, go check out their page to see for yourself tinyurl[.]com/lggdusc