Key Defining Level to Watch on China Shanghai Index
There’s been a lot of attention on China lately with regard to their economic growth potential and recent state visit to the USA.
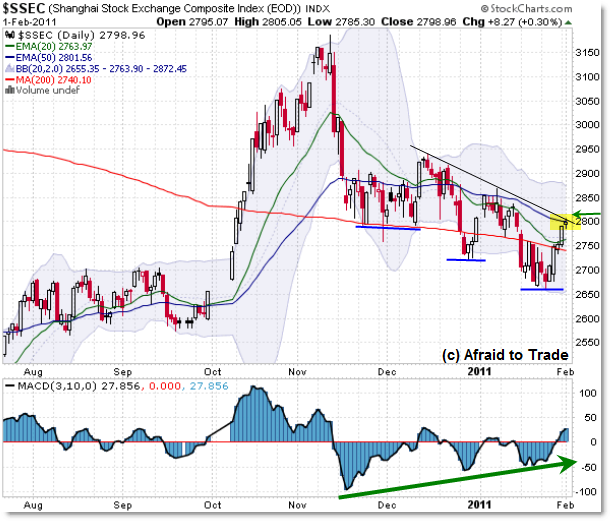
Let’s take a moment to view China’s Shanghai Stock Market Index to see its critical “Bull/Bear” Battle level which is a critical inflection point the price is battling at this moment.
A Quick View of the Daily SSEC Chart:

Usually, I start with the higher timeframe and then move to the lower, but I think the Daily Chart does the key 2,800 level justice, and then the same confluence on the weekly chart is just “Icing on the Cake.”
The main idea right now is that the Index is at a key level at 2,800.
To start, it’s the short-term falling trendline as drawn (which is actually part of a larger trendline you’ll see), and it’s also the falling 50 day EMA.
We’ll soon see the similar EMA Confluence of the 20 and 50 week EMAs here, but for now, it’s important to know that 2,800 is an imortant chart reference point.
A price breakthrough is likely to trigger a short-term move to 2,850 then 2,900 at least, if not on to break the December high at the 2,850 level. Watch those in the event we do get a bullish upside break soon.
Stepping beyond the price, we have a “Three Push” Positive Momentum Divergence into the January lows which is often – though not guaranteed – a bullish sign.
Let’s take a quick view now at the weekly chart, but not get overwhelmed by it:

This chart is more annotated than usual, so let’s cut right to the most important factors, which I labeled above.
The 20 (green) and 50 (blue) week exponential moving averages are converging at the 2,800 level, along with the drawn 38.2% Fibonacci retracement at the 2,780 level.
All of that goes along with what I wrote above on the daily chart commentary.
We can also see that the short-term trendline is actually part of a longer term line that stretches back to July 2009’s high. Interesting.
So watch price at the 2,800 level – in a similar way to how we’re watching 1,300 in the S&P 500. It’s a bull/bear battle and potential trade on a breakthrough… or breakdown (inside the little ‘flag’ trendlines) from here.
Corey Rosenbloom, CMT
Afraid to Trade.com
Follow Corey on Twitter: http://twitter.com/afraidtotrade
Order your copy of The Complete Trading Course (Wiley Finance) now available.

China 's markets appear to be closed for a few days presumably for the Chinese new year holiday, so it may be a while before the outcome is demonstrated