Making Sense of the Current SP500 Market Range
With all the headlines/news out there, how does one make sense of the current stock market landscape?
I suggest thinking of the current market – at least from its chart perspective – in terms of the dominant Price Range boundaries in terms of Value Areas.
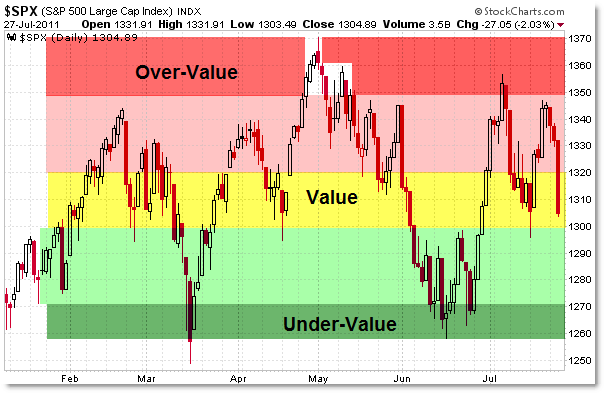
Let’s start with the simple “Value” Chart of the Current S&P 500:

The chart above is a nice update to my recent post from July 11th entitled:
“Use this Reference Chart to Make Sense of the Current SP500 Range.”
Comparing the two charts, the “Color Grid” helped us understand that risk was high to be long above the 1,350 period; risk was balanced/neutral near 1,300; and risk was high for bears/short-sellers near 1,265.
The mid-July rally rose from the 1,300 Value Area to the 1,350 “Over-Value’ area, where sellers stepped in as price was historically “Over-Valued” within the boundaries of the current Range.
Stated differently, until we get a breakout of the 2011 dominant areas, the market is Bearish above 1,350; Bullish under 1,270; and neutral near 1,300.
These Range Boundaries will remain dominant until the market breaks firmly under 1,250, at which time the market participants will seek Value (equilibrium) at a lower level, perhaps near 1,200.
Alternately, an upside firm breakthrough above 1,370 clues us in that participants are seeking a higher Value level (equilibrium) which may develop near 1,400.
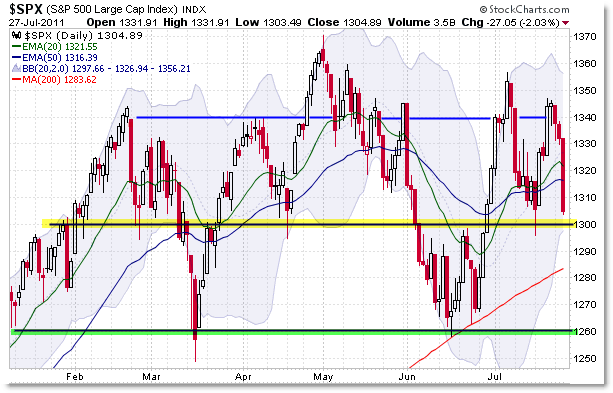
Here is a more traditional view of the current structure of the S&P 500:

In a sideways trading range, moving averages are less important than price boundaries/trendlines as long as price remains within the confines of the Range Boundaries.
The key reference levels thus become 1,340/1,350 to the upside; 1,300 (where we are right now); and 1,260 to the downside.
How the Debt Ceiling debate plays out might be the catalyst to drive us meaningfully lower from this range, or perhaps higher accordingly to how the market reacts to the news.
Anyway, short-term traders should reference these levels in conjunction with the intraday charts.
Corey Rosenbloom, CMT
Afraid to Trade.com
Follow Corey on Twitter: http://twitter.com/afraidtotrade
Corey’s new book The Complete Trading Course (Wiley Finance) is now available!

Trading or investing in the stock market is a serious matter. We must understand the basics of the stock market, before working in it. Share Tips News this glossary of stock markets. Understanding the stock market better.
This post is really nice and informative. The explanation given is really comprehensive and informative. I am feeling happy to comment on this post. I think this is useful information for users-How does the ordinary investor fit into the equation comprising of global factors coupled with manipulation in the stock markets.
indian stock market tips
current account deficit. Other reasons are the large budget deficits in
http://www.technicalstock.in/