Quick Updating Compressing TICK Volatility and Intraday Range
If you use the NYSE TICK in any way for intraday or swing trading decisions, it’s essential to update how you measure TICK readings in the context of periods of high or low volatility.
One can’t assume a TICK reading of +1,000 or -1,000 is equivalent or even a valid trading entry/exit signal in all environments.
Let’s update our ongoing “TICK Volatility Chart” to keep pace with the current low volatility “creeper trend” environment – it has clearly affected how we make intraday decisions with the NYSE TICK.

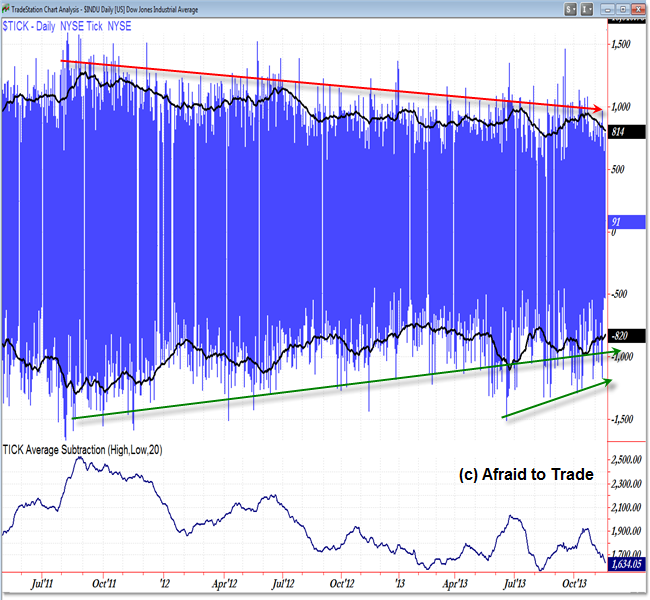
The chart above allows us to compare the NYSE TICK with the daily chart of the Dow Jones Industrial Average.
The red highlighted regions indicate periods of historically high volatility and increased intraday range in the NYSE TICK.
These correlate well with market “bottoms” or reversals up.
The two yellow highlighted regions reveal the two lowest average TICK readings for 2013 – both occurred during shallow retracements against the ongoing creeper uptrend.
The blue indicator at the bottom of the chart is the “Difference” between the 20 day average TICK high and 20 day average TICK low.
For example, if the average intraday TICK high reading is +1,000 and the average intraday TICK low reading is -1,000, then the indicator would return a value of +2,000.
We are most concerned with the average high and low (‘extremes’) of intraday TICK readings – traders often use these values for decision support (or outright triggers) for intraday trades.
We can see additional detail on a “zoomed in” or “TICK-Only” chart (below):

Again, in the context of this ongoing creeper (low volatility) rally, we’ve seen a corresponding decline in both average intraday TICK highs and intraday TICK lows.
In other words, it’s becoming more and more common to see muted or reduced intraday TICK values at the intraday extremes.
As I’ve shown repeatedly in updates, it is essential to update TICK Volatility and monitor current TICK readings within the current environment.
“Why You MUST Consider Volatility When Trading with the TICK”
“Research in Behavioral Changes in the TICK Over the Last 10 Years
At the current moment, the 20 day average intraday TICK high is +811. This means that many days DO NOT register intraday TICK highs above 1,000.
Similarly, the current 20 day average intraday TICK low is -820.
If you use the TICK in any way for intraday trading decision support, update your calculations to the current ‘low volatility’ price AND intraday TICK extreme (high/low) environment.
Finally, why exactly is this important?
Assume you use a value of +1,000 to indicate an “overbought” market and thus use a +1,000 intraday TICK reading to initiate a simple intraday short-sell position.
A trader (who is bullish) may also use a value of +1,000 to exit (take profits on) a long/buy position.
When the average intraday TICK high is +811, it means that some days – many days in fact – will NEVER see a TICK reading of +1,000.
So far, not a single trading day in November has seen an intraday TICK value above +1,000 (TradeStation data).
A ‘short-selling’ trader will never generate a trading signal; similarly, a long/buy trader will never trigger a ‘take profits’ signal.
One can see how this could be a dire problem for the intraday trader who did not adapt to the TICK Volatility Environment.
For prior updates and additional information on the “TICK Volatility” Concept, view any of the prior updates:
- May 2013: “Weekly TICK Volatility Hits 11 Year Low“
- February 2013: “Monthly TICK Distribution Chart for January”
- January 2013: “Intraday TICK High/Low Statistics from 2008 to 2013“
- January 2013: “Updating TICK Volatility Charts to Start 2013“
- October 2012: “Updating TICK Volatility for Intraday Traders“
- December 2011: “Updating TICK Extremes for Trading Reference“
- Updating TICK Extremes for Intraday Traders (June 28, 2011)
- “Why You MUST Consider Volatility When Trading with the TICK”
- “Research in Behavioral Changes in the TICK Over the Last 10 Years”
Corey Rosenbloom, CMT
Afraid to Trade.com
Follow Corey on Twitter: http://twitter.com/afraidtotrade
Corey’s new book The Complete Trading Course (Wiley Finance) is now available along with the newly released Profiting from the Life Cycle of a Stock Trend presentation (also from Wiley).

One Comment
Comments are closed.