SPX at 1,300: Double Top or Inverse Head and Shoulders
With traders focused on the S&P 500 at the round-number reference level of 1,300, let’s take a quick look at two competing classic price patterns that have formed into this critical level.
Is the S&P 500 completing a short-term “Double Top” reversal pattern or an “Inverse Head and Shoulders” continuation pattern?
Let’s look at these developments and plot classic targets and expectations.
First, the bigger Daily Picture:

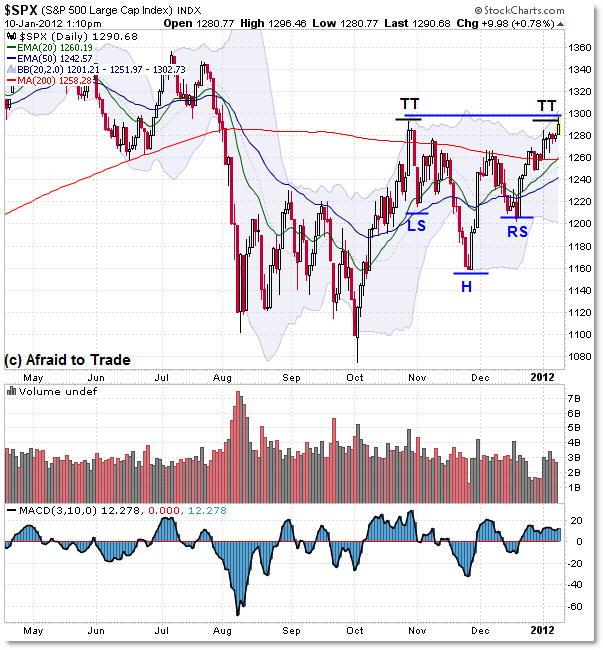
For distinction, I labeled the Double Top (“TT”) in black and the Inverse Head and Shoulders pattern in blue text.
It’s unusual to have two classic, textbook patterns competing for trader attention, and it’s even more interesting to have it happening at the critical “battle zone” of 1,300 which many traders agree to be a “Make or Break” for the market structure.
In other words, sellers draw the line at 1,300 and have placed stop-losses above 1,300 while buyers – if not already positioned – will likely enter new positions or else add to existing positions on a firm breakout above 1,300.
This is the same logic I described in my prior “January Market Structure” update last week.
Starting with the Double Top Reversal Pattern, we see two peaks into the 1,300 (technically 1,295) area and we note a clear negative divergence in both momentum and volume when compared to the October 28th peak (the origin of both these patterns).
To expect a Double Top pattern resolution, we would need to see continued FAILURE at 1,300, meaning an immediate move lower that targets 1,260, 1,240 and then moves towards the 1,160 level if not lower. That’s the Bearish Pathway.
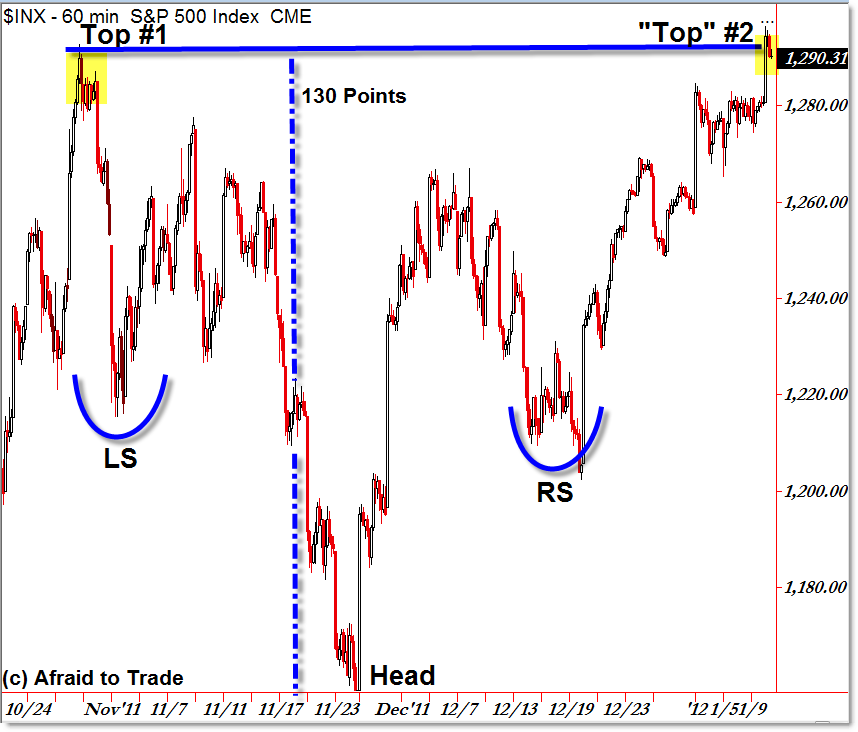
The Inverse Head and Shoulders Bullish Continuation Pattern triggers with a firm breakthrough above the “Neckline” at 1,295 (1,300 for easy math) which then projects a classical target to 1,430 (which is 130 plus 1,300 – the distance from the Neckline to the Head then added to the Neckline).
For reference, 1,430 gets us close to a longer-term upside target of the May 2008 (yes, that far back) high.
A pure-price pattern clarifies both of these competing patterns:

I’m keeping this post as simple as possible – feel free to add in your own analysis or interpretation of additional indicators and methods.
Sometimes it’s good to pull back the perspective to a “Price Purism” point of view, which is what I’m attempting to do here with a neutral bias, aware of either potential outcome.
Take a moment to look over these patterns, review classic targeting/expectations, and be ready to trade either outcome should we indeed see price confirm one of these patterns.
No matter how you define it, what happens at 1,300 will be very important to assessing future expectations.
Corey Rosenbloom, CMT
Afraid to Trade.com
Follow Corey on Twitter: http://twitter.com/afraidtotrade
Corey’s new book The Complete Trading Course (Wiley Finance) is now available!

So do you have one you are leaning towards? 🙂
Nice post and insight, thanks. From shear speculation and unbiased opinion this market appears not to go down so it must then go up….
Great clarifying post, thanks Corey……..a EUR/USD bounce could be the catalysis to resolve this to the upside…..or visa versa……
Great clarifying post, thanks Corey……..a EUR/USD bounce could be the catalysis to resolve this to the upside…..or visa versa….
JPM reports fri morning. market reaction could go either way.
Very nice Corey. Is it common to have the H&S pattern as a continuation pattern?
No, continuation head and shoulders patterns are clearly in the minority – most H&S patterns are trend reversal patterns, but the H&S can serve as either a continuation or reversal.
I'm using the word 'continuation' to mean a bullish breakthrough and continuation of the weekly/larger trend while the Double Top would be a reversal of the current move higher.
Nice work!