The SP500 and the 200 day SMA Battle
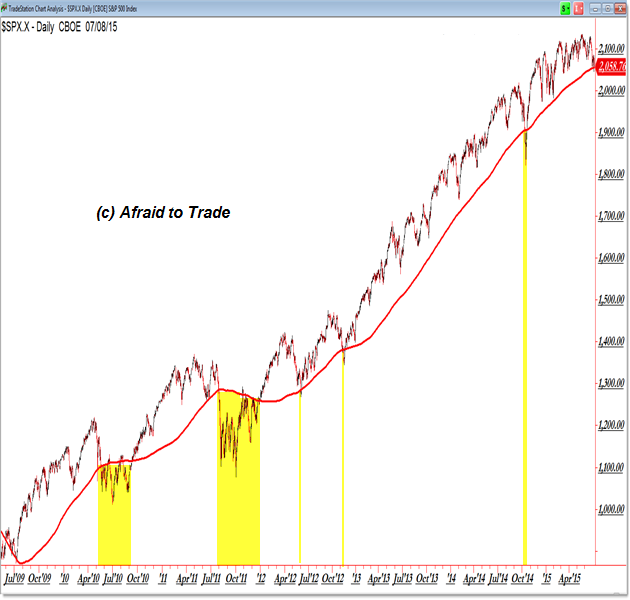
We once again find the S&P 500 fiercely challenging the rising 200 day Simple Moving Average, a key pivot level in the ongoing bull market trend.
Let’s highlight how price has behaved with respect to this key indicator going back to the start of the current bull market.
Here’s the full perspective of Price and the 200d SMA:

We’re seeing a simplified S&P 500 chart with price in the uptrend and the 200 day SMA.
Price crossed above this falling indicator in early 2009 after boosting higher from the March 2009 price low.
From there and throughout QE1 (First Round of Quantitative Easing), price remained higher until the end of QE1.
Price then remained under this level, supporting above 1,000, until QE2 was announced and implemented.
Finally, QE2 ended in July roughly at the same time as the second shatter of this key indicator.
Greece and Europe’s debt crisis made headlines at this time as well (which we’re still addressing).
Price remained beneath this level similarly for the remainder of 2011.
With two very small exceptions, price remained above the rising 200 day SMA as the bullish uptrend continued.
The ongoing purchases of QE3 correlated with the steady rise in price for many months above the 200 day SMA until the end of QE3 and the eventual breakdown event in October.
Though not causative, periods of Quantitative Easing (present or absent) correlate positively with stock prices during the bull market (and relation to the 200 day SMA).
And now, with Europe and now China back in the headlines, price once again battles with the 200 day SMA.
Continue studying the price and 200 day SMA indicator as a key pivot level with respect to the ongoing uptrend and probability for a deeper pullback (retracement).
Follow along with members of the Afraid to Trade Premium Membership for real-time updates and additional trade planning.
Corey Rosenbloom, CMT
Afraid to Trade.com
Follow Corey on Twitter: http://twitter.com/afraidtotrade
Corey’s book The Complete Trading Course (Wiley Finance) is now available along with the newly released Profiting from the Life Cycle of a Stock Trend presentation (also from Wiley).


I love using moving average but we need to be very careful in what we do it’s even the slightest mistake that could lead into several losses, I am lucky to be working with OctaFX broker which is a very fine company with excellent cTrader platform, it has epic upgraded system, so using this I can trade so much better with using any indicators and so far it has brought near-perfect results for me and that really makes me feel very comfortable!