Study Lesson on Lengthy Market Internal Divergences and Snapbacks
Students of Market Internals know that Friday’s and Monday’s sharp downside reversal in the US Stock Market was a likely outcome from the message sent from market internals.
However, that’s not the complete picture, nor is it as simple as “Divergence Equals Reversal.”
First, take a moment to review my “Charting Market Internal Divergences at the Highs” post from last week which set the stage for the upcoming dramatic price reversal.
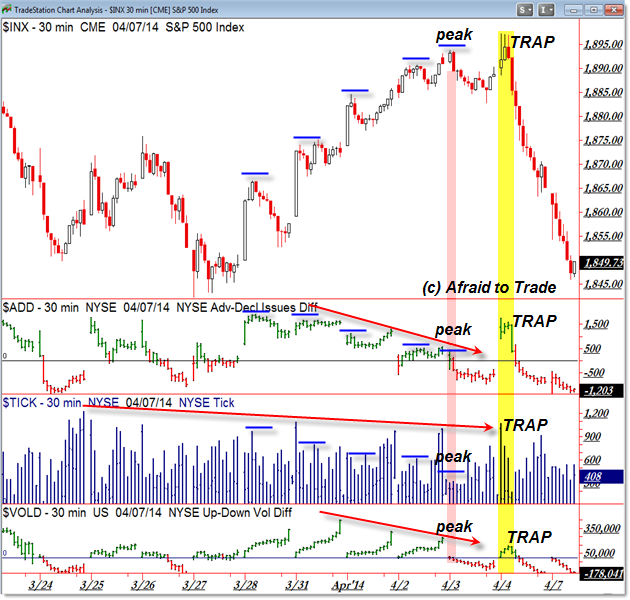
Here’s a broader picture update of the lengthy divergence and current situation for the “Big Three” Internals:

First, let’s look at the upward advance from the March 27th low to the April 3rd peak (yes, note the April 3rd peak, NOT the April 4th peak).
Each day price crept to new highs, Market Internals registered lower highs. In simpler terms, while the broader S&P 500 index (the way it is calculated) advanced in price terms, fewer stocks were advancing with the index (neither was volume or momentum).
Market Internals actually peaked on March 28th which is typical of a short-term market swing. We tend to see the strongest (highest/peak) value in Market Internals at the start or “Kick-off” of a swing; as the swing progresses, we tend to see divergences develop.
Here’s a general principle to keep in mind – the longer the price swing and the more extended the divergences, the more powerful (or painful) the “snap-back” or reversal will be when price does give ground to reality.
It’s like a rubber band – the further you stretch it from the anchor point (which was near 1,850 in S&P 500 terms above), the resolution (snap-back) of the band will be more violent/rapid when it is let go.
It’s not much different with indexes and internals.
I mentioned the April 3rd peak and NOT the April 4th peak for a reason. Price “gave it one more go” into all-time highs just shy of the 1,900 target but the result was a vicious, deceptive, misleading Bull Trap.
See plenty of posts in the archive discussing the concept of “Traps and How to Trade Them.”
This is one of the most frustrating concepts for new traders to grasp – we can easily see an overextended and divergent market but we can’t predict the exact reversal point.
In this example, price had one more “last gasp” or “dying breath” of upward price before the actual reversal in price.
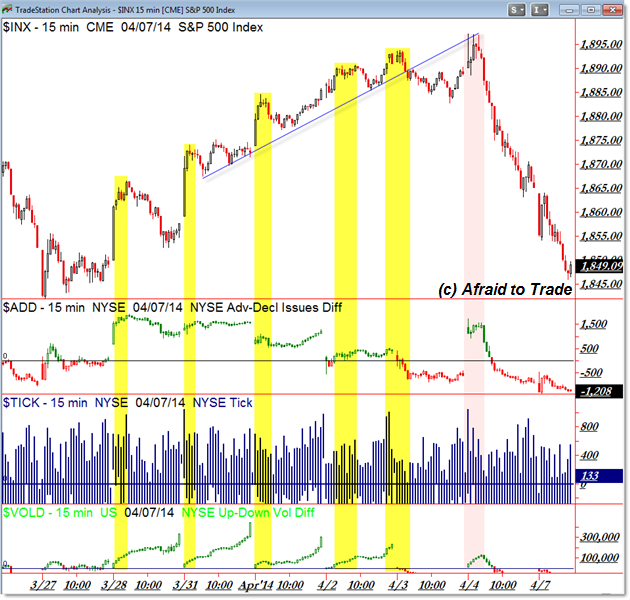
Let’s see this scenario as depicted on lower frame charts:

I highlighted each new price swing high with the corresponding value in Market Internals at the time (15-min chart).
Note the trendline break of April 3rd which was the actual “peak” of the market ahead of a “dead air” or “shock” trap that occurred on the gap-up Friday morning.
The picture is similar – and visually clearer – on the 5-min compressed chart (of Breadth):

As price pushed to new highs with the “troops” or Market Internals falling back (declining/diverging), the risk increased for a retracement.
The longer the situation extended, the risk increased for a violent reaction which is indeed what occurred.
At this point, price collapsed straight back to the “anchor point” of the rubber-band analogy which is where the divergence began (March 28).
New traders should compare internals with price, and not be lulled into a false sense of security by a rising market and the pain of missing out.
All is well when internals rise (increase) with a rising market; all is not well when internals diverge with price.
The odds of a reversal increase as the price is extended in a divergent situation – the longer the divergence, the more rapid/violent the resolution.
The same logic is true with a market falling/declining yet internals are strengthening (forming a series of higher lows).
Continue studying this situation and the many similar examples so you can be prepared the next time this situation occurs (and it will).
Follow along with members of the Daily Commentary and Idealized Trades summaries for real-time updates and additional trade planning.
Corey Rosenbloom, CMT
Afraid to Trade.com
Follow Corey on Twitter: http://twitter.com/afraidtotrade
Corey’s new book The Complete Trading Course (Wiley Finance) is now available along with the newly released Profiting from the Life Cycle of a Stock Trend presentation (also from Wiley).


2 Comments
Comments are closed.