Rounded Reversal Underway in Stocks
I highlighted this possibility last night to a few people but now it appears confirmed that the US Stock Market – as described in the DIA – is completing a short-term (intraday) Rounded Reversal Pattern that appears to be setting up a counter-trend rally.
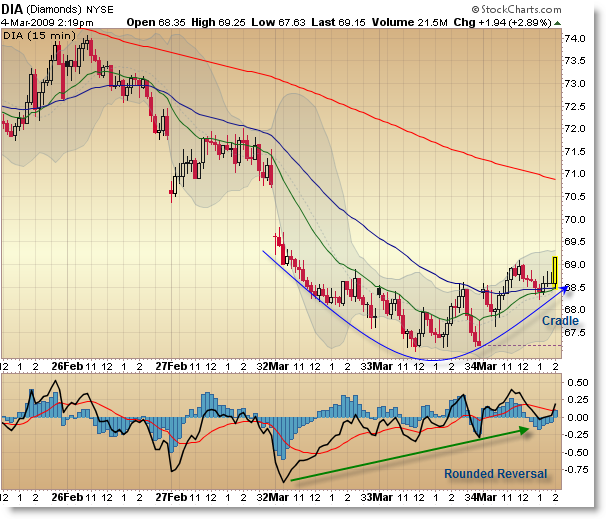
DIA 15-min:
If anything, this serves as an excellent example of the components that make up this pattern.
Price, in a downtrend, forms an initial positive momentum divergence (lower price low on higher low in the oscillator) and then comes back to form a support level as the momentum oscillator continues to rise.
Price then makes an upward thrust (into $68.50, or resistance via the 50 EMA) on a new momentum high, swing back to test support, and then completes a mirror image of the down-move that formed the pattern in the first place.
Price breaks above the key EMA resistance and then finally the averages cross bullishly. The “Cradle Trade” I’m so fond of sets up as price comes down to test this EMA confluence (cross-over) level, setting up the highest probability buy point (because you have enough evidence of a possible reversal and also a very tight stop if wrong).
There’s no guarantee we’ll keep moving higher of course, but odds do seem to favor a counter-swing rally up which would likely form an Elliott fractal 4 Wave up in the larger (5) wave down.
But if Elliott isn’t your cup of tea, then odds seem to favor a retracement rally up perhaps to $72.50 or even – theoretically – as high as $80 (which would be a very big move) as the next likely swing. A more realistic target would be near the $75.00 range.
Of course, any bullish case is defeated with a penetration of support at $67.00 (6,700 in the Dow Jones).
Join up with the Market Club for additional commentaries, trade ideas, education, scans, and signals.
Corey Rosenbloom
Afraid to Trade.com
Follow Corey on Twitter: http://twitter.com/afraidtotrade
Register (free) for the Afraid to Trade.com Blog to stay updated
SPX 5 min looks like a cup and handle forming. I acutally saw the rounded Reversal on my charts and said “let me go over to Afraidtotrade, and see if he sees it” Sure enough. Thanks for teaching me that pattern!
Pikertrader
Piker,
haha thanks for thinking about me with the trade! If I’m famous for any trade, it’ll be the Rounded Reversal, “Three Push,” and Cradle Trade.
I’ll keep pointing them out as I see them!
Hi cory Have a question about the Elliot wave count for the S & P 500 . With reference to your post
http://blog.afraidtotrade.com/two-competing-elliott-wave-counts-on-the-sp-500/
I suppose that you are in agreement with the scenario (1) and that we need to complete a wave 4 (up) and a wave 5 ( down ) of the bigger 5th wave to complete the bear market . If so, could you please explain how you have ruled out the possibility of scenario (2).
regards
Vasu
Hey Vasu,
The quick answer is that I haven’t. And I don’t think we’ll know for sure until we get the next ABC Structure to see how far it carries, what the momentum is like, what sentiment is like, etc.
Either way, we’re due for an ABC… be it a big ABC up after the full 5 waves have completed, or a larger ABC to finish off Wave 4.
Still not 100% sure right now but the pathway for both scenarios points the same way. We’ll know in a few months.
Vasu,
What tipped me to lean towards the “We’re in Wave 5” posture is Robert Prechter getting on TV and basically saying that was the case – he’s calling for a big ABC up which is indicative of the 5-wave decline being finished. I’d rather stake my lot with Prechter for the time being since he is the expert.
Corey, as wave 5 down has broken the 741 support, and that too rather violently, it implies that it is not a truncated wave 5, and the fact that the retracement of wave 4 up was just about a meager 0.382 of the wave 3 decline, I believe that wave 5 down still has a long way to go before trend reversal or big ABC up that you mentioned referencing Robert Prechter. It is possible that the current wave 5 down will be as damaging as its predecessor wave 3. Let us not be afraid of the reversal and miss out on most of this big one down.
Corey,
Trying to Elliott count the down wave that started Feb 26 AM. It looks like Wave 3 bottomed midday Mar 3, and so we’re still in wave 4? Any earlier count of the end of wave 3 seems to make 4 and 5 awful short, if indeed we are reversing up as you say.
Oddly it’s like a microcosm of the discussion as to whether big wave 3 already ended, or whether it’s still going on. I guess fractals are like that.
Thank you very much Cory :
Another Q of mine is that do you use the theory of point and figure Bullish percentages to do your long term buy strategies . If not could you please illustrate your rules for investments ?
regards
Vasu
That being said, if wave 5 hasn’t completed, once it does we would expect a short-term (weeks) reversal into S&P 730 or so, no?
Also, I’ve always wondered how we know in which time frame to use the MACD — look at this in 5s instead of 15s and it looks very different.
Also, I never know which momentum peak to use as the right end of these divergences. You could use a different one and argue that your diagonal line ended on Tue morning, and we already had the upswing (a day-long wave 4. Aren’t wave 4s always the most difficult to count?)
Finally, why use DIA instead of .SPX?
Sorry about all the questions. Thanks.
NotAfraid,
I’m starting to lean that way too (that of a possible violent 5th) for the reasons you mentioned but also because the sentiment isn’t in “panic” land yet. The Put/Call ratio is just to low relative to the recent past, as is the $VIX. People still seem complacent and figure “The worst is over. Bottom is here or near.”
That’s not the expected sentiment at a bottom so it leads me to question how bad this 5th wave will be….
Kevin,
Precisely! The fractals are what cause so much confusion!
An associate of mine seems to think we’re extending the current 3rd wave (of 5) which is possible. Gosh that leads to some bearish targets though.
I’m just trying to play one day and one swing at a time and manage risk/get profits intraday within the expected structure I see.
Vasu,
I don’t use Bullish %s but I probably should. They would help give a sort of breadth and/or sentiment (perhaps) reading.
I invest mainly using sector rotation and intermarket asset rotation strategies.
Kevin,
I’ll have to address the targeting issue in an upcoming post perhaps. There’s Fibonacci confluence at 780 if we get that high.
Short-term structure precedes long-term structure. A NMH on a 5-min will often precede a NMH on a higher timeframe. A trend reversal (EMA cross, etc) on the 5-min will precede one on a 30min chart (or just result in a whipsaw).
4’s could be most difficult because they can result in triangles or complex flats. 2’s are usually sharp or zig-zags and end quickly.
I’ve been studying the Dow since my early intro to TA in 2002 so it’s ingrained in my psyche. I prefer how the numbers work and how the Dow Mini contract (amount) trades, plus it’s easy to get a picture of the Dow by looking at 30 stocks.
I’m honestly needing to quit being a dinosaur and move to the E-Mini (S&P) because I believe the Dow Index now has serious problems because 5 stocks are under $10 and it’s price-weighted. The S&P is becoming far more accurate so I’ll have to make the switch.
Oh, and I show the DIA because I trade off the @YM but like the way StockCharts shows their charts and they don’t have the Dow Mini Futures contract to chart.