What We Thought was a Sideways Range was NOT What We Assumed
Quite simply, what we THOUGHT was a Sideways Range was NOT actually a Sideways Trading Range.
What’s changed our thinking and what does it mean about the current state of the coiled stock market?
Let’s take a look:

First, let’s build off an assumption that we’re challenging.
I’d multiple times recently assumed that the S&P 500 was “coiling” or trading within a well-defined sideways rectangle (horizontal trading range) which was similar to that of January (ahead of February’s breakout).
See the recent posts: “Still on Breakout Watch for the S&P 500” and “Triple US Stock Market Index Update.”
The quick expectation from those posts was that price would continue bouncing sideways in a sideways trading range.
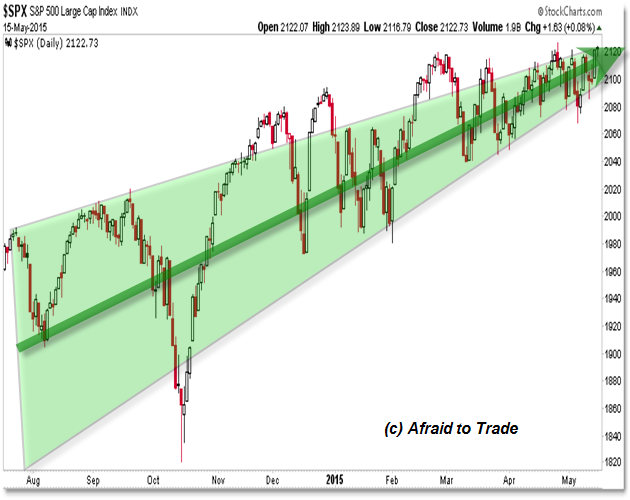
In reality, what we’re seeing is NOT a Sideways Rectangle Range but instead a RISING, compressing trendline pattern similar to a Rising Wedge.
It makes a big difference, given that a simple breakout beyond a sideways resistance high “should” lead to an impulsive bullish breakout like that of February.
However, expand back the perspective to a pure price chart with the Broader Picture highlighted Green:

Notice the difference?
There IS no Rectangle!
What we’re seeing in a long-term rising wedge or compressing trendline channel that is reaching equilibrium.
In classic Technical Analysis, this would suggest a bearish outcome of a potentially violent or volatile downside swing (like that into October).
Here’s two more recent posts to review on this subject of “We’re about to go into a Volatile Period:”
“Current Volatility Environment Forecasting a Higher Volatility Environment”
“A Quick Way to Chart Volatility Cycles in the Market”
Indeed we’ll adjust quickly to the bearish side if the market falls and holds under 2,075.
However, we’ll place today’s tiny bullish action – the “failure” to break impulsively to new highs (so far) – as part of this higher timeframe perspective of the lengthy Wedge pattern and persistent bullish upside action.
Rise above the tiny, one-month “Rectangle” and put the monthly pattern into the context of what is a YEARLY pattern that has been developing – of which what we thought was a rectangle is actually the latter part of a much larger bullish wedge.
Follow along with members of the Daily Commentary and Idealized Trades summaries for real-time updates and additional trade planning.
Corey Rosenbloom, CMT
Afraid to Trade.com
Follow Corey on Twitter: http://twitter.com/afraidtotrade
Corey’s book The Complete Trading Course (Wiley Finance) is now available along with the newly released Profiting from the Life Cycle of a Stock Trend presentation (also from Wiley).


Thank you. Very interesting interpretation.